Filmora
Filmora - AI Video Editor
Edit Faster, Smarter and Easier!
OPEN

Animated Charts Maker:
Create Animated Charts & Graphs for Data Visualization

Turn raw data into compelling stories. Filmora's Animated Charts lets you import CSV or Excel files, generate chart and graph animations in one step, and adjust styles without complex keyframes. Build dynamic bar, line, pie, and area charts — even bar chart races and data tables — with an animated chart creator made for both beginners and pros.
Win 11 / Win 10 / Win 8 / Win 7 (64 bit OS) | System Requirements
macOS 10.15 - macOS 26 (10.14 or earlier? Click here) | Apple M1, M2, M3 & M4 compatible
Turn raw data into compelling stories. Filmora's Animated Charts lets you import CSV or Excel files, generate chart and graph animations in one step, and adjust styles without complex keyframes. Build dynamic bar, line, pie, and area charts — even bar chart races and data tables — with an animated chart creator made for both beginners and pros.

Your All-in-One Video Data Visualization Toolkit

Everything you need to create data-driven videos: fast data import, smart animation presets, and powerful style customization. No technical skills required – our video chart maker handles the complexity for you.

One-Click Data Import & Animation

Simply drag and drop your CSV or Excel (XLS/XLSX) files, and watch as our intelligent system automatically detects data types, formats, and maps columns to chart elements — making it easier than ever to turn your data into animated visualizations. Filmora also supports complex datasets with multiple columns and time series data.
  • Smart Data Detection
    Automatically recognizes rows and columns.
  • Multiple File Formats
    CSV and Excel (.xlsx, .xls)
  • Large Dataset Support
    Handle files up to 1MB with hundreds of data points.
after-tag
slider-btn

Smart Data Animation Presets

Choose from multiple professionally designed animation presets for chart entry, growth, sorting, highlighting, and more. Just select your preferred style and watch your data come to life — no keyframes, no expressions. Each preset is optimized for different data types and storytelling needs, ensuring your animated charts look natural and hold attention. Perfect for:
Business
Corporate Growth
Financial Reports
KPI Dashboards
Creativity
Social Media
Educational Content
Entertainment

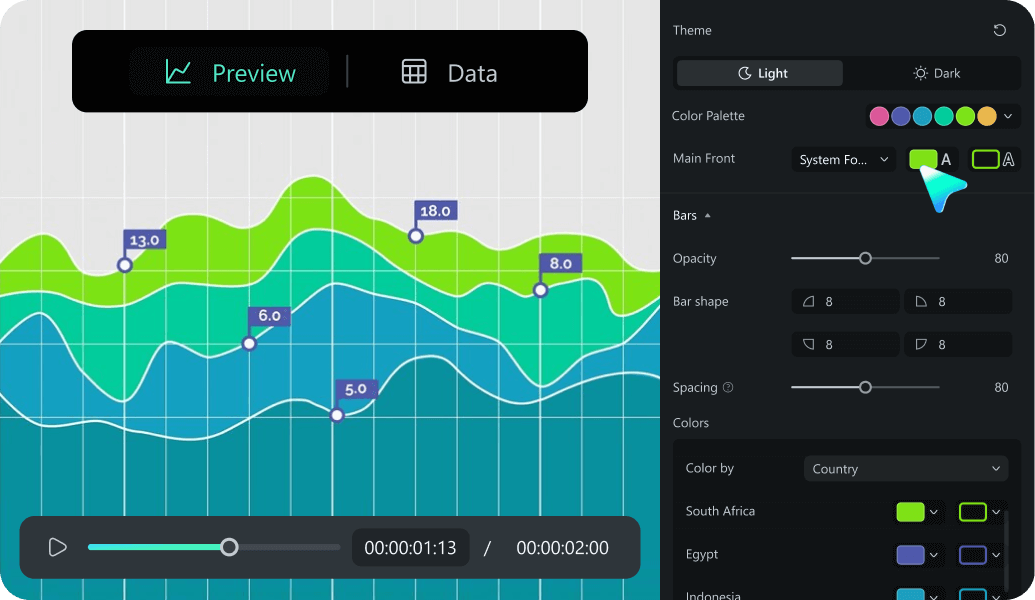
Advanced Customization

Customize every aspect of your animated data visualization. From colors and fonts to shapes and layouts - create charts that perfectly match your brand. More flexible than CapCut, easier than After Effects.
  • Custom color palettes
  • Font & typography control
  • Shape & border styling
  • Label positioning
  • Background effects
  • Legend adjustments
animated charts and graphs customization
edit icon

Edit Like Regular Video
Clips

Charts and graphs are native timeline clips: trim, cut, re-order, add transitions, effects, and captions. Data updates propagate to the animation—no re-builds.
data storytelling icon

Data Storytelling,
End-to-End

From import to animation to final export, our graph animation maker streamlines data storytelling—create, animate, style, and deliver without leaving your video editor.
professional video data visualization icon

User-Friendly,
Professional Quality

No coding or design experience required. Our intuitive interface makes data animation accessible to everyone, from beginners to professionals.

Support for All Chart Types

From simple bar charts to complex data visualizations. Create any type of animated chart your content needs.

Bar & Column Charts
Perfect for comparing categories and showing growth over time.
Line Charts
Ideal for displaying trends and changes across continuous data.
Pie & Donut Charts
Show proportions and percentages in a visually engaging way.
Area Charts
Visualize cumulative totals and volume changes over time.
Column Chart (Grouped)
Compare multiple categories side by side within the same time frame or group.
Bar Chart Race
Create dynamic racing bar animations to show ranking changes.

How To Create Animated Data Charts

No expressions, no graph plugins. A guided, creator-friendly workflow for video data visualization.

Step 1. Pick a Data Visualization Type
Open Filmora and go to Effects > Video Effects > AI Infographic > Animated Charts. Browse through our library of chart animations, including bar charts, line charts, and more. Select the chart type that best fits your needs.
open the animated chart video maker
Step 2. Upload Data (CSV/Excel)
Switch to the Data tab and upload your CSV/Excel file to the chart video maker.
upload csv or excel data
Step 3. Animate Data with Presets
Our smart system automatically detects the uploaded file and maps the data to the picked animation chart or graph. You can switch to the Preview tab to see the magic in real time.
animate your data
Step 4. Customize and Export
Set colors, borders, fonts, labels, and legends to match your brand. Edit the chart like any clip—then export in your preferred format.
customize the created chart animation
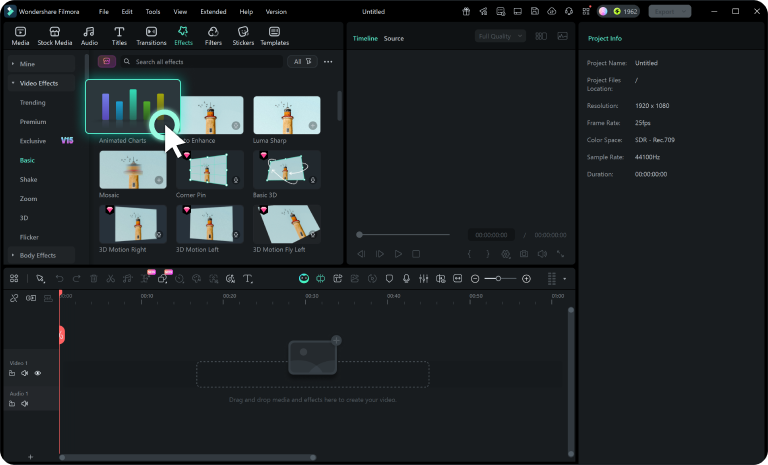
  • Step 1: Pick a Data Visualization Type
    Open Filmora and go to Effects > Video Effects > AI Infographic > Animated Charts. Browse through our library of chart animations, including bar charts, line charts, and more. Select the chart type that best fits your needs.
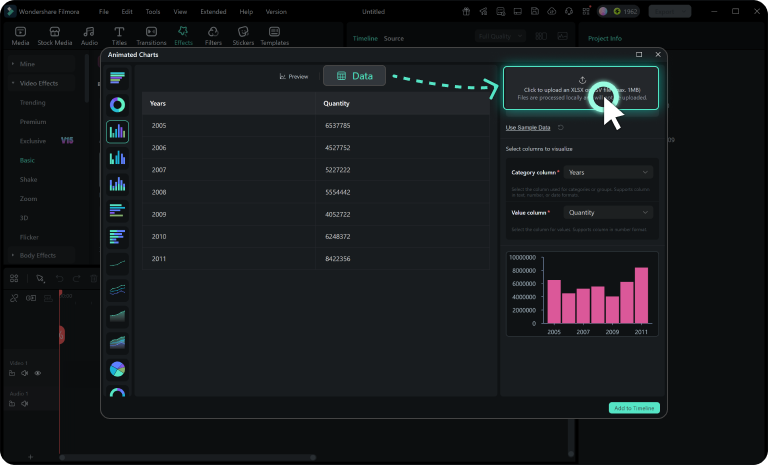
  • Step 2: Upload Data (CSV/Excel)
    Switch to the Data tab and upload your CSV/Excel file to the chart video maker.
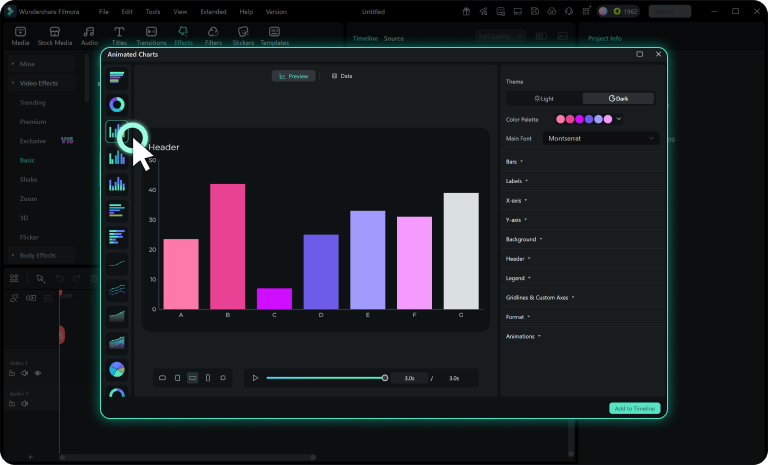
  • Step 3: Animate Data with Presets
    Our smart system automatically detects the uploaded file and maps the data to the picked animation chart or graph. You can switch to the Preview tab to see the magic in real time.
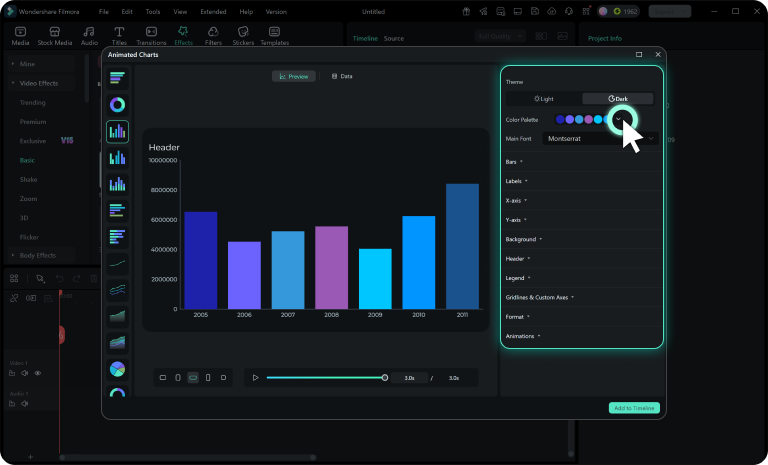
  • Step 4: Customize and Export
    Set colors, borders, fonts, labels, and legends to match your brand. Edit the chart like any clip—then export in your preferred format.

Perfect for Every Content Creator

From education to entertainment, animated data visualization enhances every type of content. See how creators across industries use Filmora's Animated Charts.
create aniamted charts for educational content

Educational Content - Teachers, Trainers & Course Creators

Turn spreadsheets into animated charts for lectures and tutorials. Build clear comparisons, timelines, and progress visuals without advanced tools.
  • Science & research presentations
  • Student engagement & retention
  • Online course content
create sales and market shifts for business and marketing video

Business & Marketing - Executives, Analysts & Marketers

Present KPIs, rankings, and market shifts with clear motion cues. Keep colors and typography aligned with brand guidelines in every data video.
  • Quarterly & annual reports
  • Sales performance tracking
  • Investor presentations
turn trending data into animated data graphics

Social Media Content - Influencers, Marketers & Creators

Create viral-ready content that stops the scroll. Turn trending data into animated data graphics for social media that generate likes, shares, and comments across all platforms.
  • Instagram & TikTok videos
  • YouTube explainer content
  • LinkedIn thought leadership
create professional data animation in documenraries

Documentary Production - Filmmakers & Journalists

Bring real-world data to life in your documentaries. Create compelling visual narratives with professional data animation that supports your storytelling without breaking the budget.
  • Climate & environmental data
  • Economic & social trends
  • Historical comparisons

Why Choose Filmora for Video Data Visualization

See how Filmora's chart animation maker compares to other solutions. Get the power of professional tools with the simplicity you need.

Feature
Filmora Animated Charts
After Effects + Premiere
DaVinci Resolve
CapCut
Easy Data Import
CSV, Excel
direct import
JSON, CSV, TSV, BVH
via MOGRT
Excel/CSV via Data
Storyteller plugin
CSV upload +
online editing
One-Click Animation
10+ chart animation types
included
Manual template
creation required
Plugin-based or
manual node setup
Fixed animation
presets
Customization Level
Full control,
easy UI
Unlimited but
complex expressions
High via
Fusion nodes
Limited
preset styles
Learning Curve
5 minutes
to master
Weeks/months
AE expertise needed
Steep node-based
workflow
Easy but
limited features
Pricing
$79.99/year
included All features
$263.88/year
Creative Cloud required
Free/$295
Pro version for plugins
Free
Basic features only
Production Time
5-10 min
From data to video
3-5+ hours
Template creation + setup
2-5 hours
Plugin/manual workflow
20-30 min
Limited customization
Auto-layout Adaptability
Smart scaling for
data changes
Manual template
reconstruction needed
Plugin
dependent
Fixed layouts
only
advantage-icon

10x Faster Than
Professional Tools

While After Effects requires complex MOGRT workflows with expressions and keyframes taking hours or days, and DaVinci Resolve needs manual Fusion node setup or plugin dependency, Filmora delivers the same professional results in minutes with simple one-click import and instant animation generation.

Average Time Saved: 4.5+ hours per project
advantage-icon

No Technical
Skills Required

Unlike After Effects which demands expertise in expressions, keyframes, and complex template creation, or DaVinci Resolve's steep learning curve with Fusion node-based workflows, Filmora eliminates all technical barriers through its intuitive visual interface that anyone can master.

95% of users create their first chart in under 10 minutes
advantage-icon

More Flexible Than
Simple Tools

While CapCut offers only basic preset templates with fixed layouts and limited customization, and other simple tools restrict creativity with preset-only approaches, Filmora provides professional-grade customization options through an easy-to-use interface without sacrificing creative control.

Unlimited customization without complexity

Frequently Asked Questions

Filmora's Data Visualization supports all major data formats including Excel files (.xlsx, .xls), CSV files. Our smart parser automatically detects column types and suggests optimal visualization formats for your specific dataset.
Absolutely not! Filmora's video data visualization feature is designed for everyone. No coding, no complex software knowledge required. Our drag-and-drop interface and pre-built chart animation templates make it possible for anyone to create professional-quality animated charts. 95% of our users create their first animation within 10 minutes of starting.
Our chart animation software can handle datasets up to 1MB in size with over 1000 data points. For most business and educational use cases, this is more than sufficient.
You can export your animated data visualizations in multiple formats: MP4 video (up to 4K resolution), GIF animations (perfect for social media), PNG image sequences (for advanced editing), and WebM format (optimized for web). You can also directly share to YouTube, Instagram, TikTok, and other platforms.
Yes! Filmora's Data Visualization offers extensive customization options including custom color palettes, text fonts, logo integration, animation timing controls, legends, and labels. The real-time preview feature lets you see changes instantly.
You can try the data visualization templates and preview the results for free. However, to export videos without a watermark, you'll need to purchase a plan that includes creative assets.
Filmora's Data Animation delivers professional results with remarkable simplicity compared to After Effects' complex workflow. While After Effects requires technical expertise in expressions, keyframes, and template creation—often taking hours or days to produce animated charts—Filmora allows users to import CSV or Excel files and generate polished data visualizations in minutes. This accessibility makes Filmora ideal for content creators, educators, and businesses who need regular animated charts without investing time in learning advanced motion graphics techniques.
The key difference lies in adaptability and workflow efficiency. After Effects templates often break when data changes, requiring manual adjustments to spacing and animations when scaling from 4 to 7 data points, for example. Filmora's intelligent system automatically adapts to any data size while maintaining professional presentation quality. Although After Effects offers unlimited creative control for complex custom animations, Filmora provides the perfect balance of professional output and user-friendly operation for 90% of data animation needs, delivering the same visual impact without the technical barriers.
Yes! All animated charts and visualizations created with Filmora can be used for commercial purposes including client presentations, marketing materials, social media content, documentaries, and educational courses. There are no additional licensing fees or restrictions on commercial use of your created animations.

What Our Customers Say About Us

customer jason
Sarah Chen
High School Math Teacher
"My students were falling asleep during statistics lessons until I started using Filmora's animated charts. Now they actually get excited about data analysis! Test scores improved by 25% this semester."
customer emily
Mike Rodriguez
Marketing Director
"Board presentations used to be death by PowerPoint. Now our quarterly reports feature stunning data animations that keep stakeholders engaged. ROI visualization has never been this compelling!"
customer mark
Emma Thompson
YouTuber
"My data-driven content gets 3x more engagement since switching to Filmora animations. The animated visualizations are Instagram-ready and my audience loves them. Saved me hundreds of hours!"
customer david
Lisa Martinez
Documentary Filmmaker
"My climate change documentary wouldn't be the same without Filmora's animated data sequences. Complex environmental data becomes accessible to everyone."