Data Visuliazation
Data visualization is one of the most excellent tools the world has ever known. From its inception, it has been used to convey messages which are hard to understand by a human mind via simple images and graphics. We will show you how to use data visualization for your tutorial video.
Tool
Assets


Transcript
A data display is a visual representation of raw or processed data that aims to communicate a small number of insights about the behavior of an underlying table, which is otherwise difficult or impossible to understand to the naked eye.
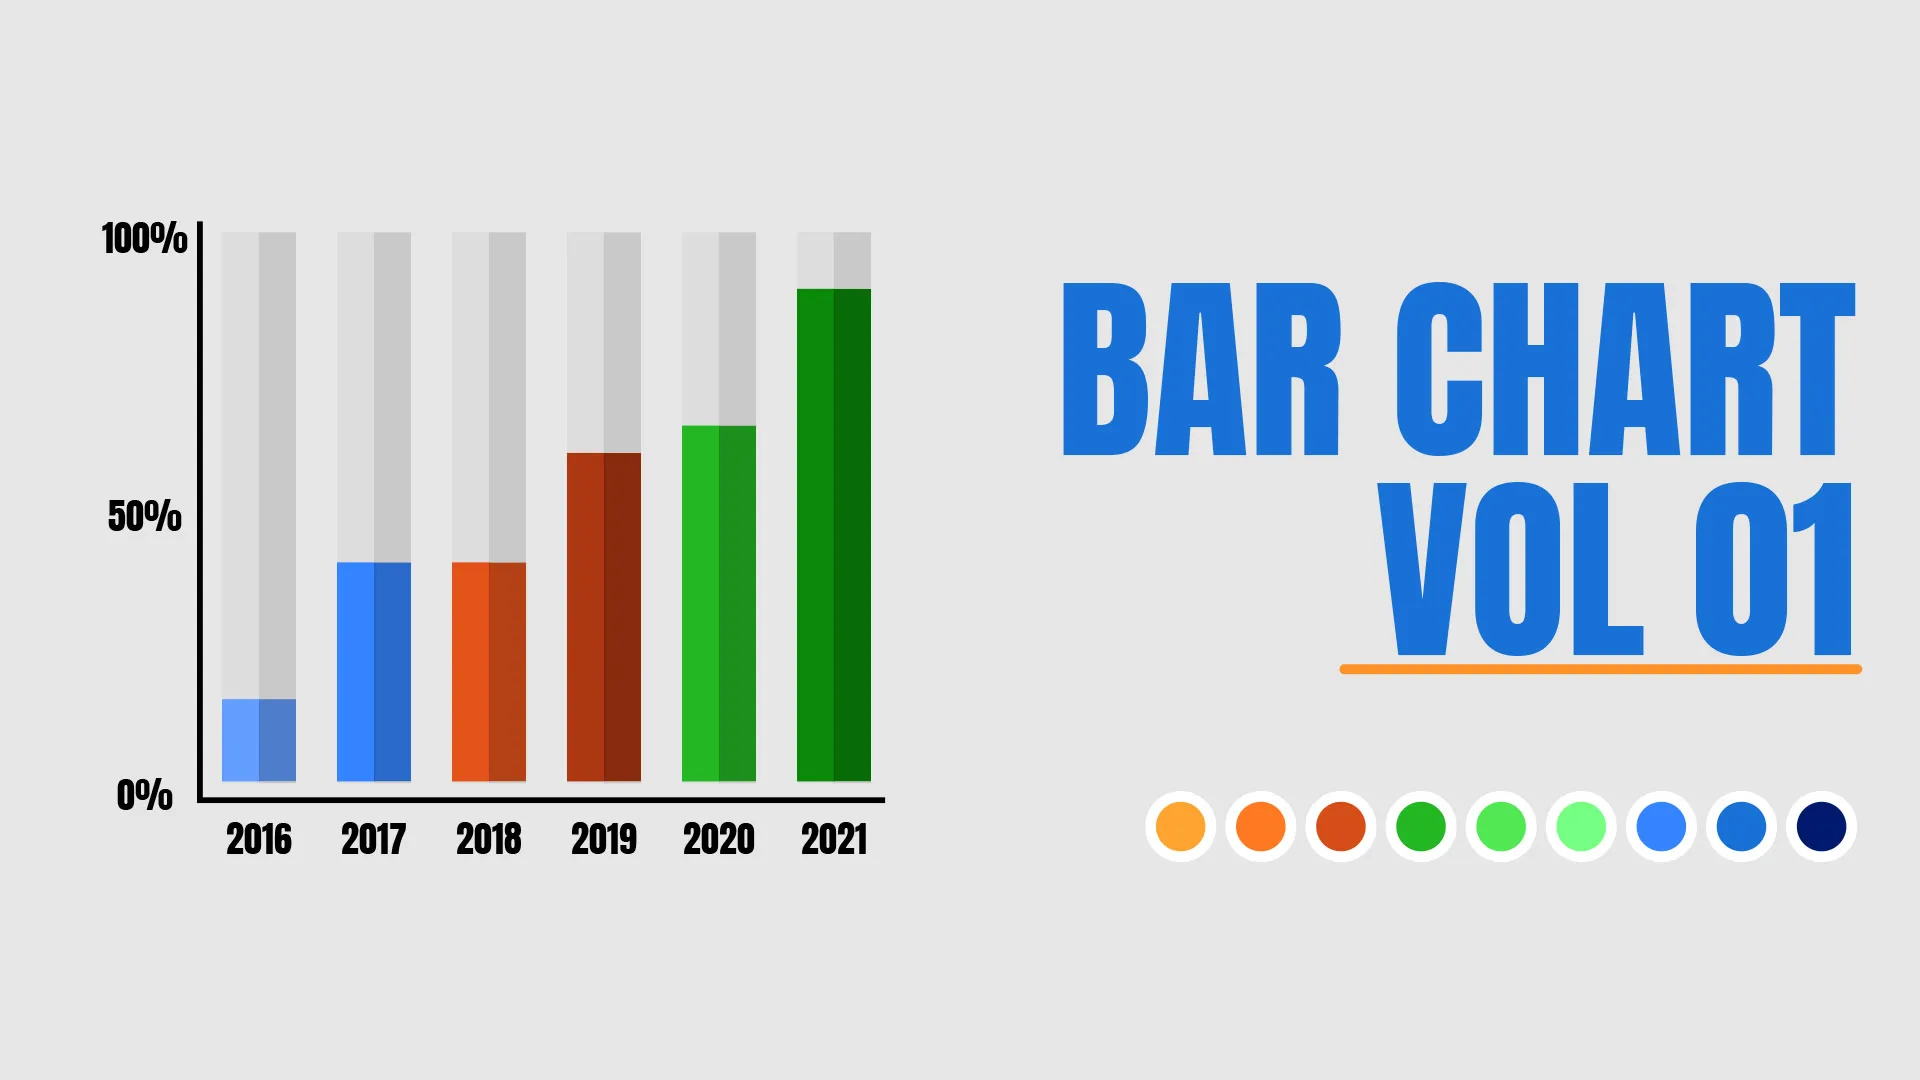
Filmora provides over 500 chart formats that allow you to present clear values on teaching videos, and of course, they're all royalty-free.
No matter your content, whether it's about economy, nutrition, science or technology, you can always find what you need.
To do this in Filmora is super easy. We just need to search the keyword in the search bar and select your desired data display board to go with your content.
Then, under the elements tab, you can find charts in different styles, including bar, high 3d block and more. Drag and drop the chart element onto the timeline and adjust the size and position to fit with the core.
Now we finish the data display board, suppose you're looking for more results just click the download icon under this drop-down menu in Filmora and you'll be redirected to the filmstock webpage here. You can get everything you need for your video creation just simply searches by using keywords.
In addition to the data chart, there are also openers, titles callouts transitions, stickers, end screens, and so much more. These powerful, comprehensive effects library definitely will stimulate your inspiration and creativity in your video creation journey.
How to Visualize Data in Your Video with Filmora
What you need to prepare:
- A computer (Windows or macOS)
- Media files(video clips/audio/data)
- Filmora video editor
Once Filmora is installed on your computer, run the program and click on the new project button to start a new project.
You need to import the video to your Filmora Library. You can do this easily by clicking on the File > Import media, and then import media files. Now select the video from your computer on which you want to add elements and click open. It will add the video to your Filmora library.

Now, drag the video from the Filmora Library and drop it in your timeline. Then go to the search bar and type the "blocks." You will see plenty of different data displays. Just drag the one you want to use in your video and drop it in the track above your video.
Then, under the elements tab, you can find charts in different styles, including bar, high 3d block, and more. Drag and drop the chart element onto the timeline and adjust the size and position to fit with the core.

Suppose you're looking for more results, click the download icon under the drop-down menu in Filmora, and you'll be redirected to the Filmstock webpage. There you can get everything you need for your video creation. Simply search by using keywords.
What you've learned:
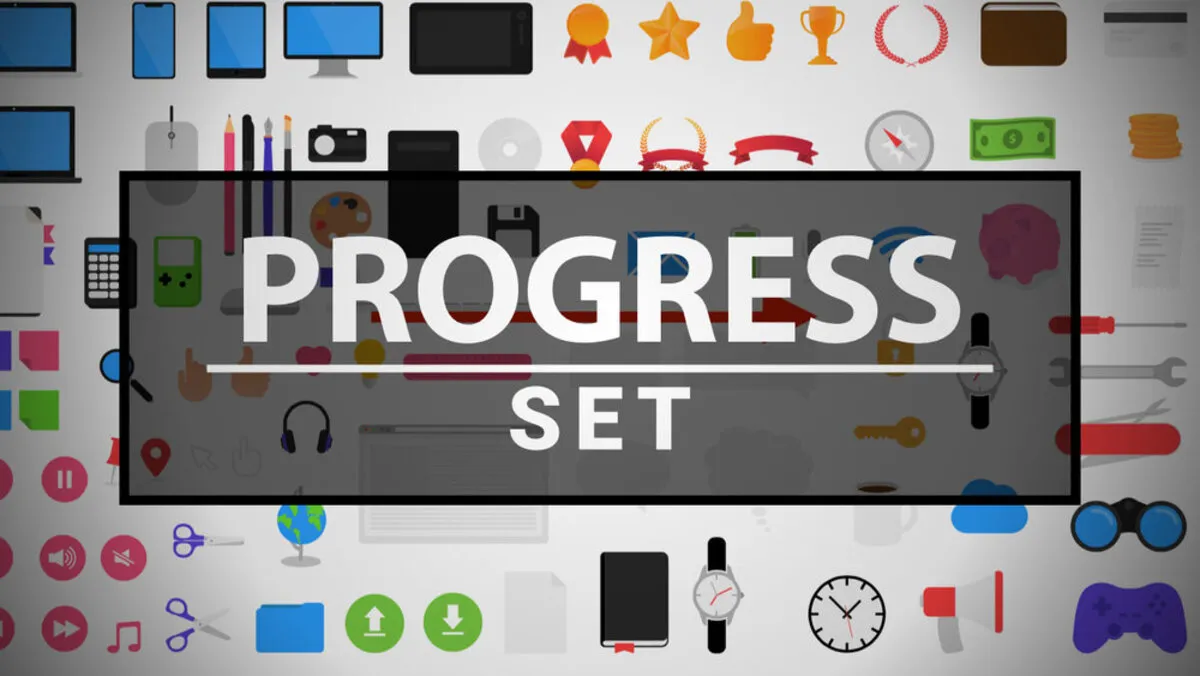
- You can use pie chart, bar, progress bar to visualize your data in video..
- You can find more assets in Filmora Elements & Effects.
- Now you can use Filmora to visualize your data in video.