100% Security Verified | No Subscription Required | No Malware


 ChatGPT
 Perplexity
 Gemini
 Claude
 Grok
Grok
Have you ever wished that your video could explain data in an engaging way that also facilitates high levels of information retention? Well, that's where charts come in. They turn facts into visuals that viewers remember, which is exactly what you want in lesson plans, launch promos, and different types of presentations.
Today, you can learn about the main ways to add charts to videos, which chart works where, and a new chart engine will let you do it all in one place. Stick around to find out more.
In this article
Different Ways to Add Charts to Videos

If you thought that there was one "right" way to do this, then you would have been wrong. Depending on the tools you use and how much time you have, you can add charts to videos in various ways. Today, we'll talk about the most common ones.
- Use built-in chart and graphic features in video editors: Powerful video editors today can create charts based on your data directly inside the video editing timeline. This is highly beneficial for creators, as they gain access to consistent fonts and colors, a range of motion presets, and direct synchronization with music or voiceovers, all in one place. There is no need to switch between various tools for different tasks.
- Create charts in spreadsheet tools and insert them into editors: If you want to go the slightly longer route, you can build a chart in Excel or Google Sheets, export it as a PNG or MP4 file, and then import it into your video editing project. This is a reliable way to do it, but you sacrifice design consistency and fine-tuned animation control.
- Leverage online tools that generate animated charts: You can find chart tools online for free. Web apps offer a variety of presets, and some of them even include exciting options like bar chart races. You can export the chart photo or video from the web app and upload it to your video editor to continue working.
- Screen-record live dashboards and overlay them: Recording a business intelligence dashboard works for demos and corporate tutorials. Ensure that the overlays are readable, mask sensitive data, and add callouts to help viewers follow your cursor.
How to Add Charts to Videos?
As we have deduced, the best way to add a chart to a video is to use a powerful video editor that offers a feature that can convert data into charts. One such tool is Wondershare Filmora, a top-rated video editing software with data visualization features.
 secure download

This software makes the entire process easier with a new data visualization feature that converts data into animated pie, bar, column, area charts, and more. Filmora also offers numerous customization options. You can style your charts using theme modes, different color palettes, cool main fonts, different types of bars and labels, change the background color, add animations, change chart headers, and so more.
In addition to that, if you have already converted the data to a chart picture, you can import the chart to Filmora and add it to videos with an AI-powered method like AI video element adder (but it limits the video length) or a normal drag-and-drop way.
Convert Data to Animated Charts and Add Them to Videos Directly
As we've covered, Wondershare Filmora's animated charts feature lets you turn raw data into popular animated charts—then drop them directly onto your video timeline. This cuts out the time-consuming work of creating animated charts manually and switching between separate tools to add them to your videos. Here are the steps.
- After downloading and installing Filmora on your computer, launch the software and start a new project.
secure download
- Go to Effects > navigate to AI Infographic > double click the Animated Charts to activate the feature.
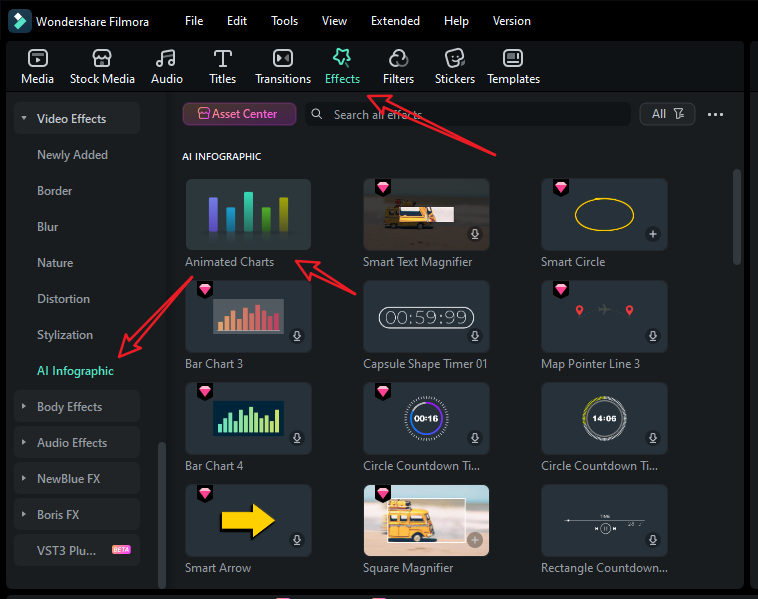
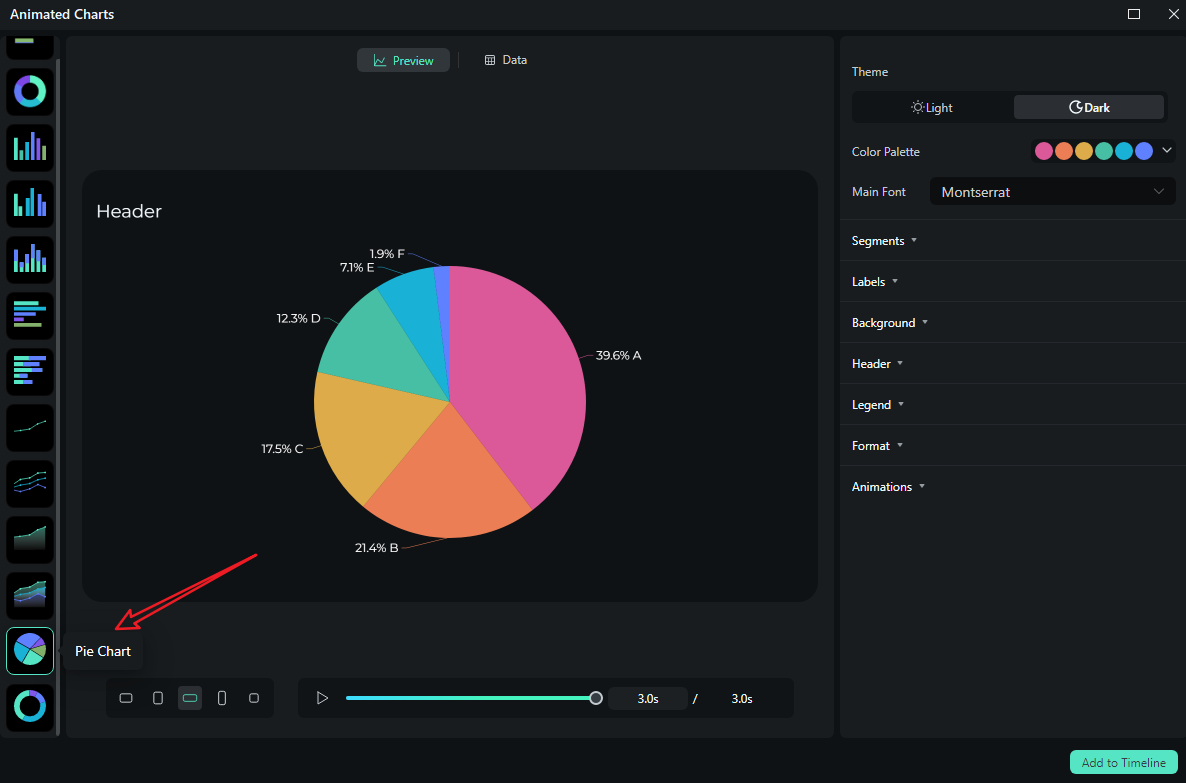
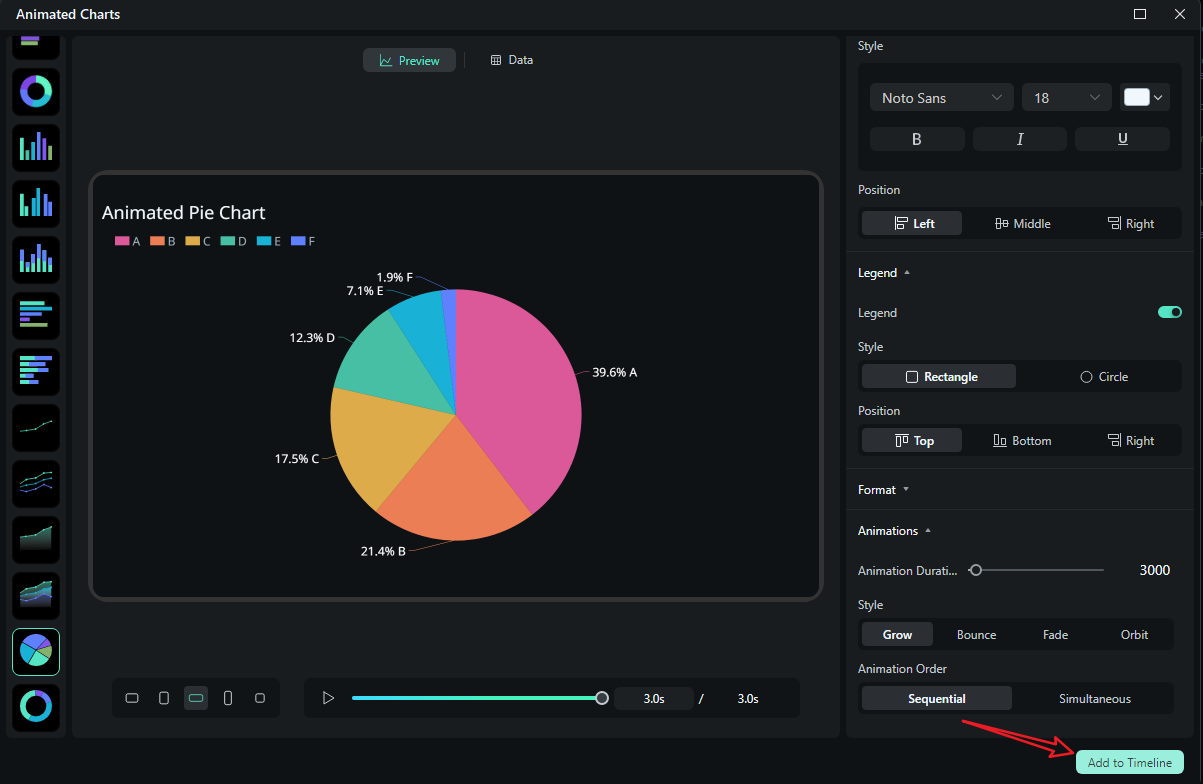
- View and pick an animated pie chart template on the left side.
- Switch to the Data section to upload your Excel file or edit the sample data column.
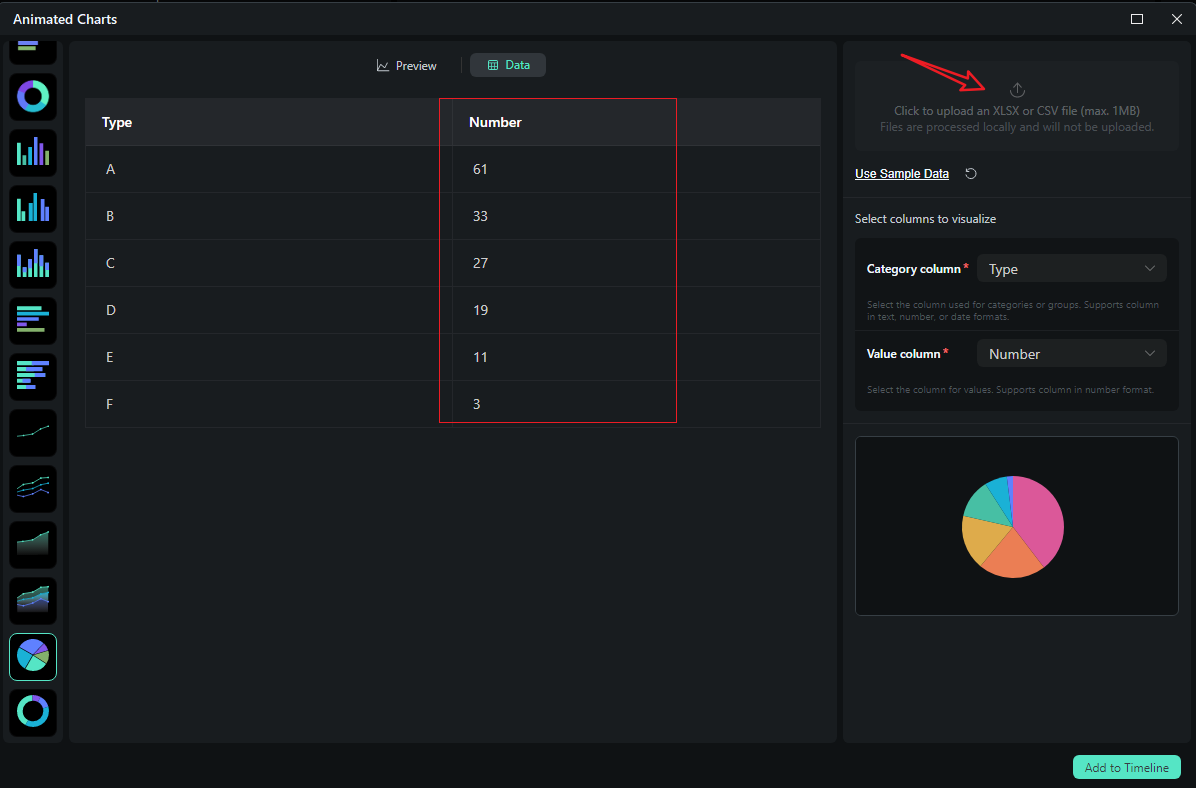
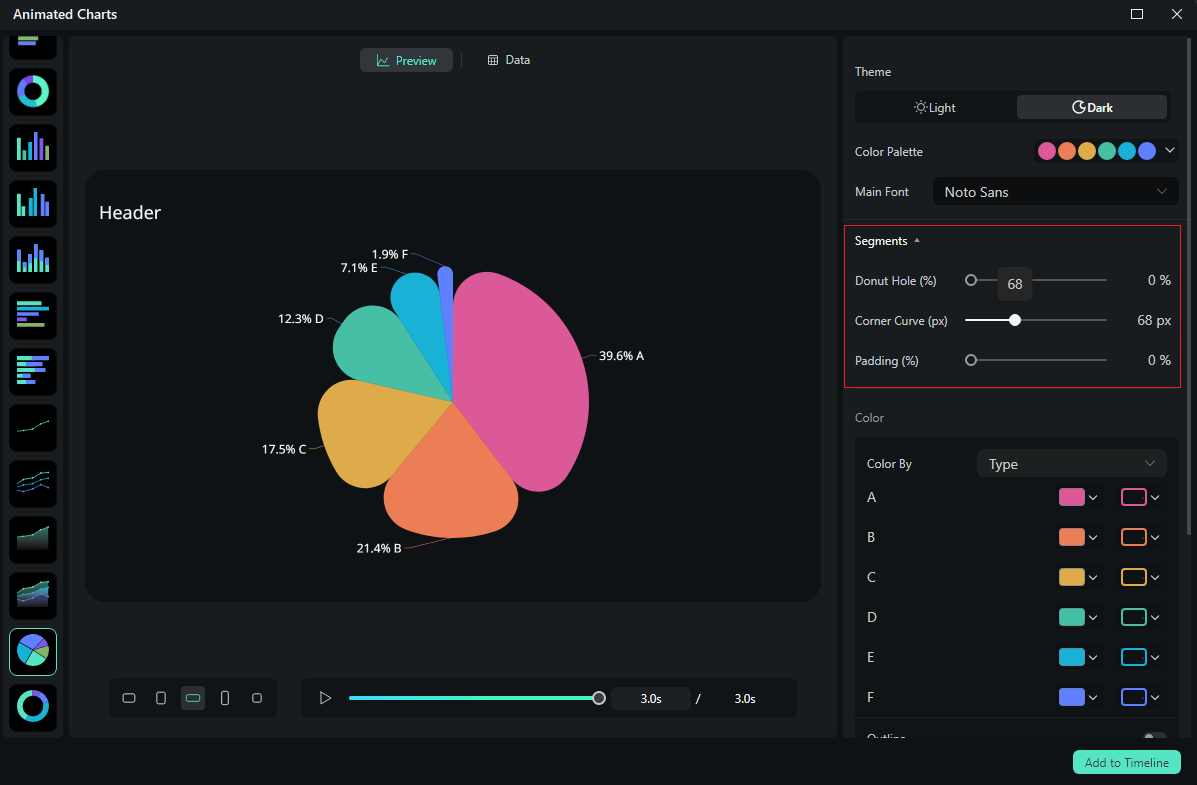
- After uploading the file or editing the data, review it and select what you want to visualize. Switch to the Preview section > you can adjust theme, main font, segments, labels, background, header, format, animation styles, animation orders, aspect ratio, and more accordingly.
- If you are satisfied with the result, you can click on add to the timeline.
- You can place the animated charts on a video, and adjust the duration, position, blending mode, chroma key, and more. Finally, choose to export the video if you are satisfied.
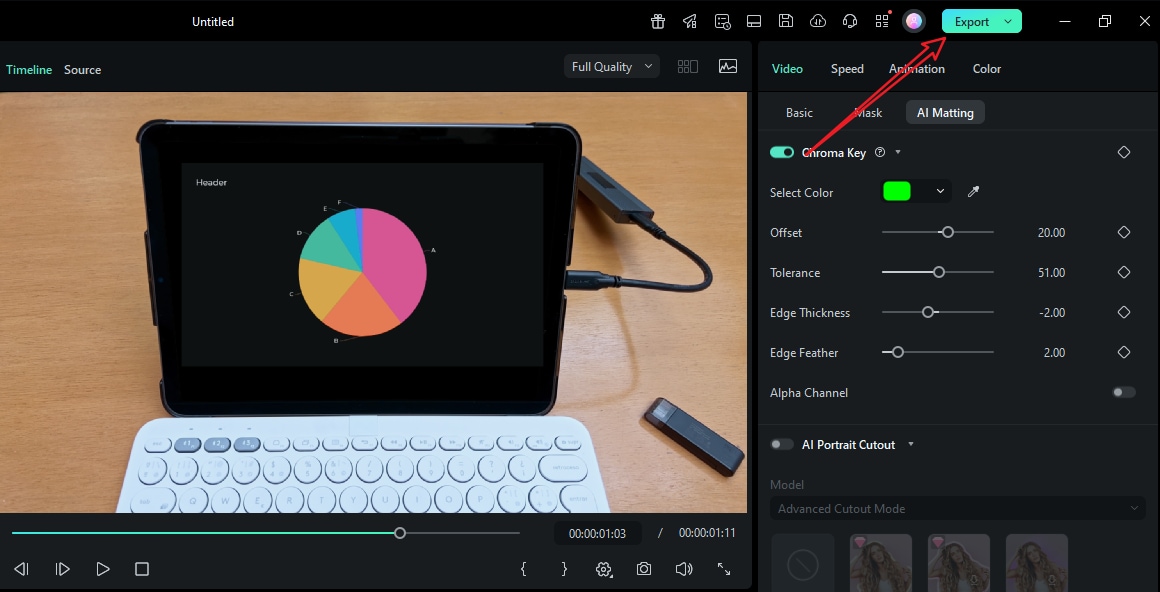
Let's see the final results after adding the animated pie chart to the video in Filmora.

Add Animated Charts to Videos with Normal Editing Features
Here are the steps to add bar charts to videos in Filmora.
- Download and install Filmora on your computer.
secure download
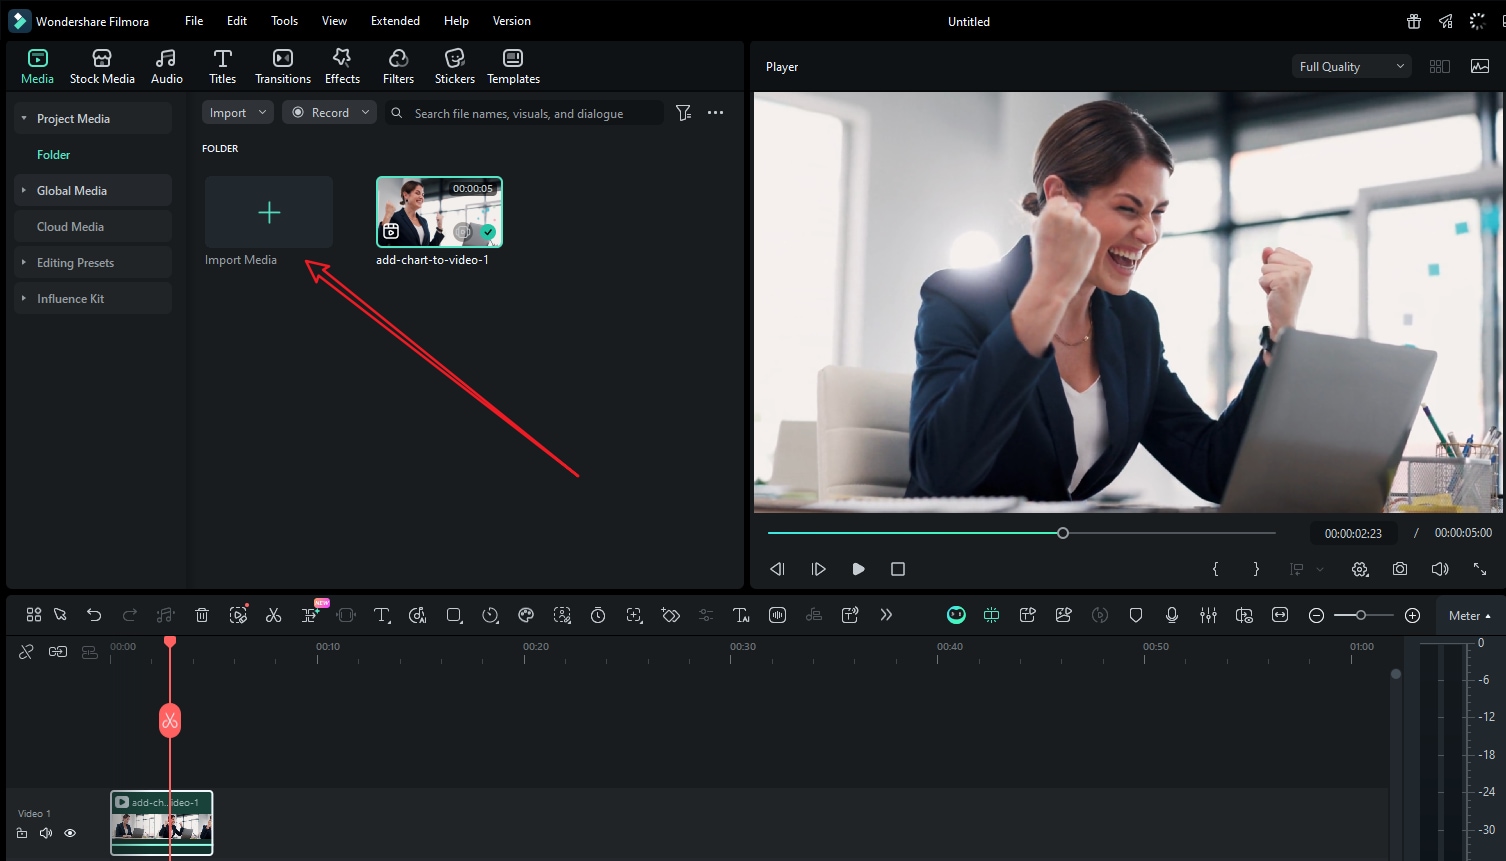
- Import your clip and a chart picture if you have.
- Alternatively, you can add an animated chart to videos by navigating to Effects > AI Infographic > pick a chart according to your preference.
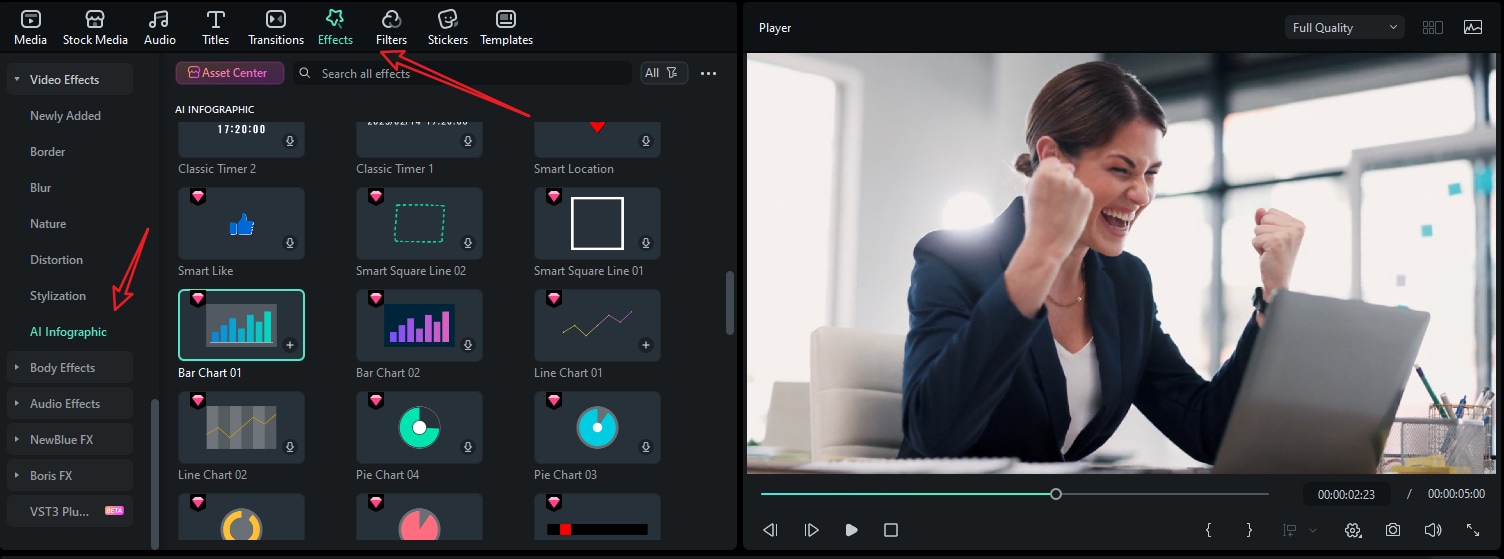
- Drag the chart to the timeline and customize the mask, color, position, speed, number, and more.
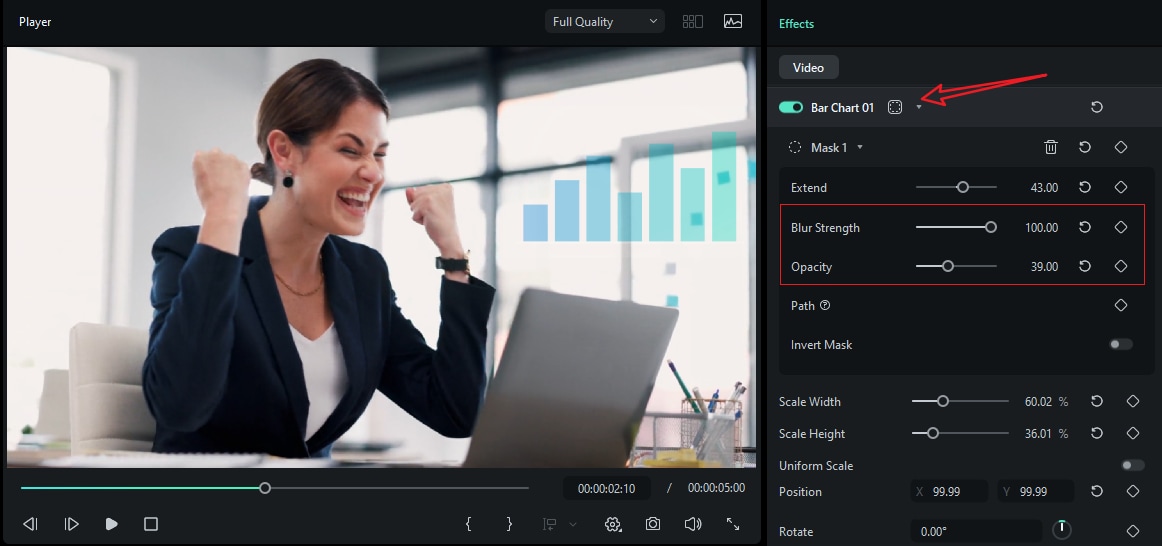
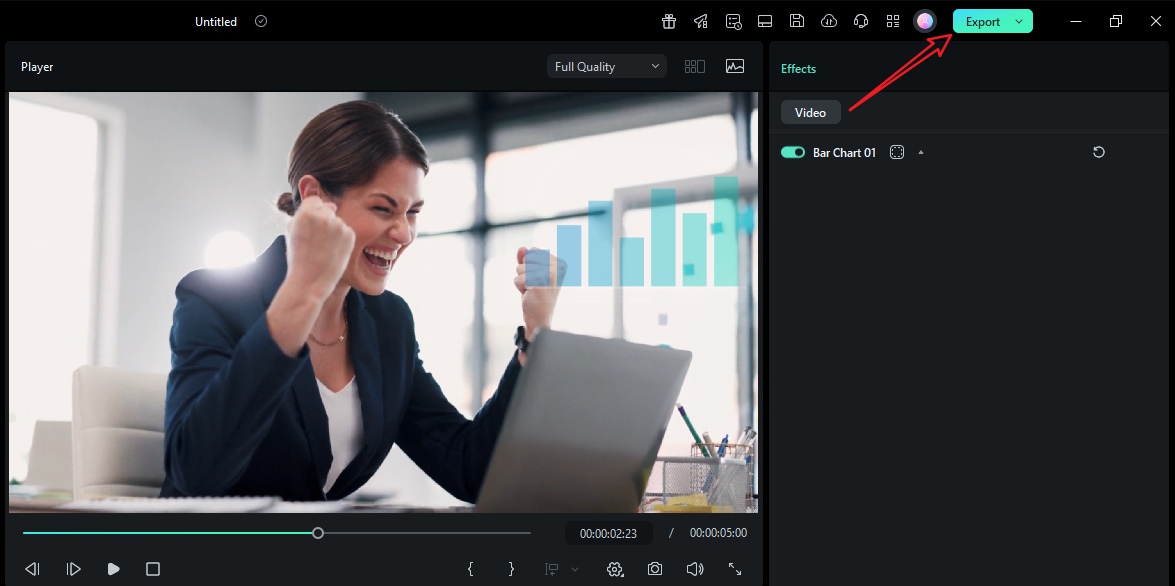
- Preview the result and tap on Export to save it if you are satisfied.
Types of Charts You Can Add to Videos
Depending on the statistic you are examining and the type of video you are working on, you may want to use a different type of chart. In the table below, we will list all the most popular types of charts and which type of video they are best suited for.
| Chart Type | Best For | Example Video Use |
| Bar / Column | Comparing categories | Feature adoption by region in a launch recap |
| Bar Chart Race | Change over time + ranking | Decade-long growth of app downloads |
| Pie / Donut | Share of a whole | Market share in a product pitch |
| Line / Area | Trends over time | Monthly engagement walk-through |
| Scatter | Correlations | A/B test results explainer |
| Stacked Bars/Areas | Composition + trend | Budget breakdown across quarters |
| Radar / Spider | Multi-metric profiles | Camera review: specs at a glance |
Conclusion
What makes charts so powerful? The easy answer is that they help viewers understand complex concepts easily. Therefore, if you're creating a video that involves data, you need a fast way to convey your message so that viewers can grasp everything without pausing. And, with Filmora's new chart maker feature, your numbers will look and move like the rest of your video. It will be clean, branded, and on the beat.
Try Filmora today to create awe-inspiring videos with easy data charts that will push you ahead of your competition.
secure download