100% Security Verified | No Subscription Required | No Malware


 ChatGPT
 Perplexity
 Gemini
 Claude
 Grok
Grok
In the age of video-first content, data doesn't just need to be accurate—it needs to captivate. Whether you're crafting a YouTube tutorial, a LinkedIn business update, a TikTok explainer, or an educational clip, animated pie charts have emerged as a game-changer for turning dry numbers into engaging stories.
They guide viewers through proportions, highlight key insights, and make trends feel tangible—all while keeping attention spans hooked. But here's the catch: not everyone has access to premium design software or the budget to hire a designer. The good news? There are powerful free pie chart video makers that let you create professional-looking animated pie charts without breaking the bank.
This article will walk you through everything you need to know about using the best pie chart video maker to make animated pie charts for your videos.
In this article
Why Use an Animated Pie Chart in Videos?
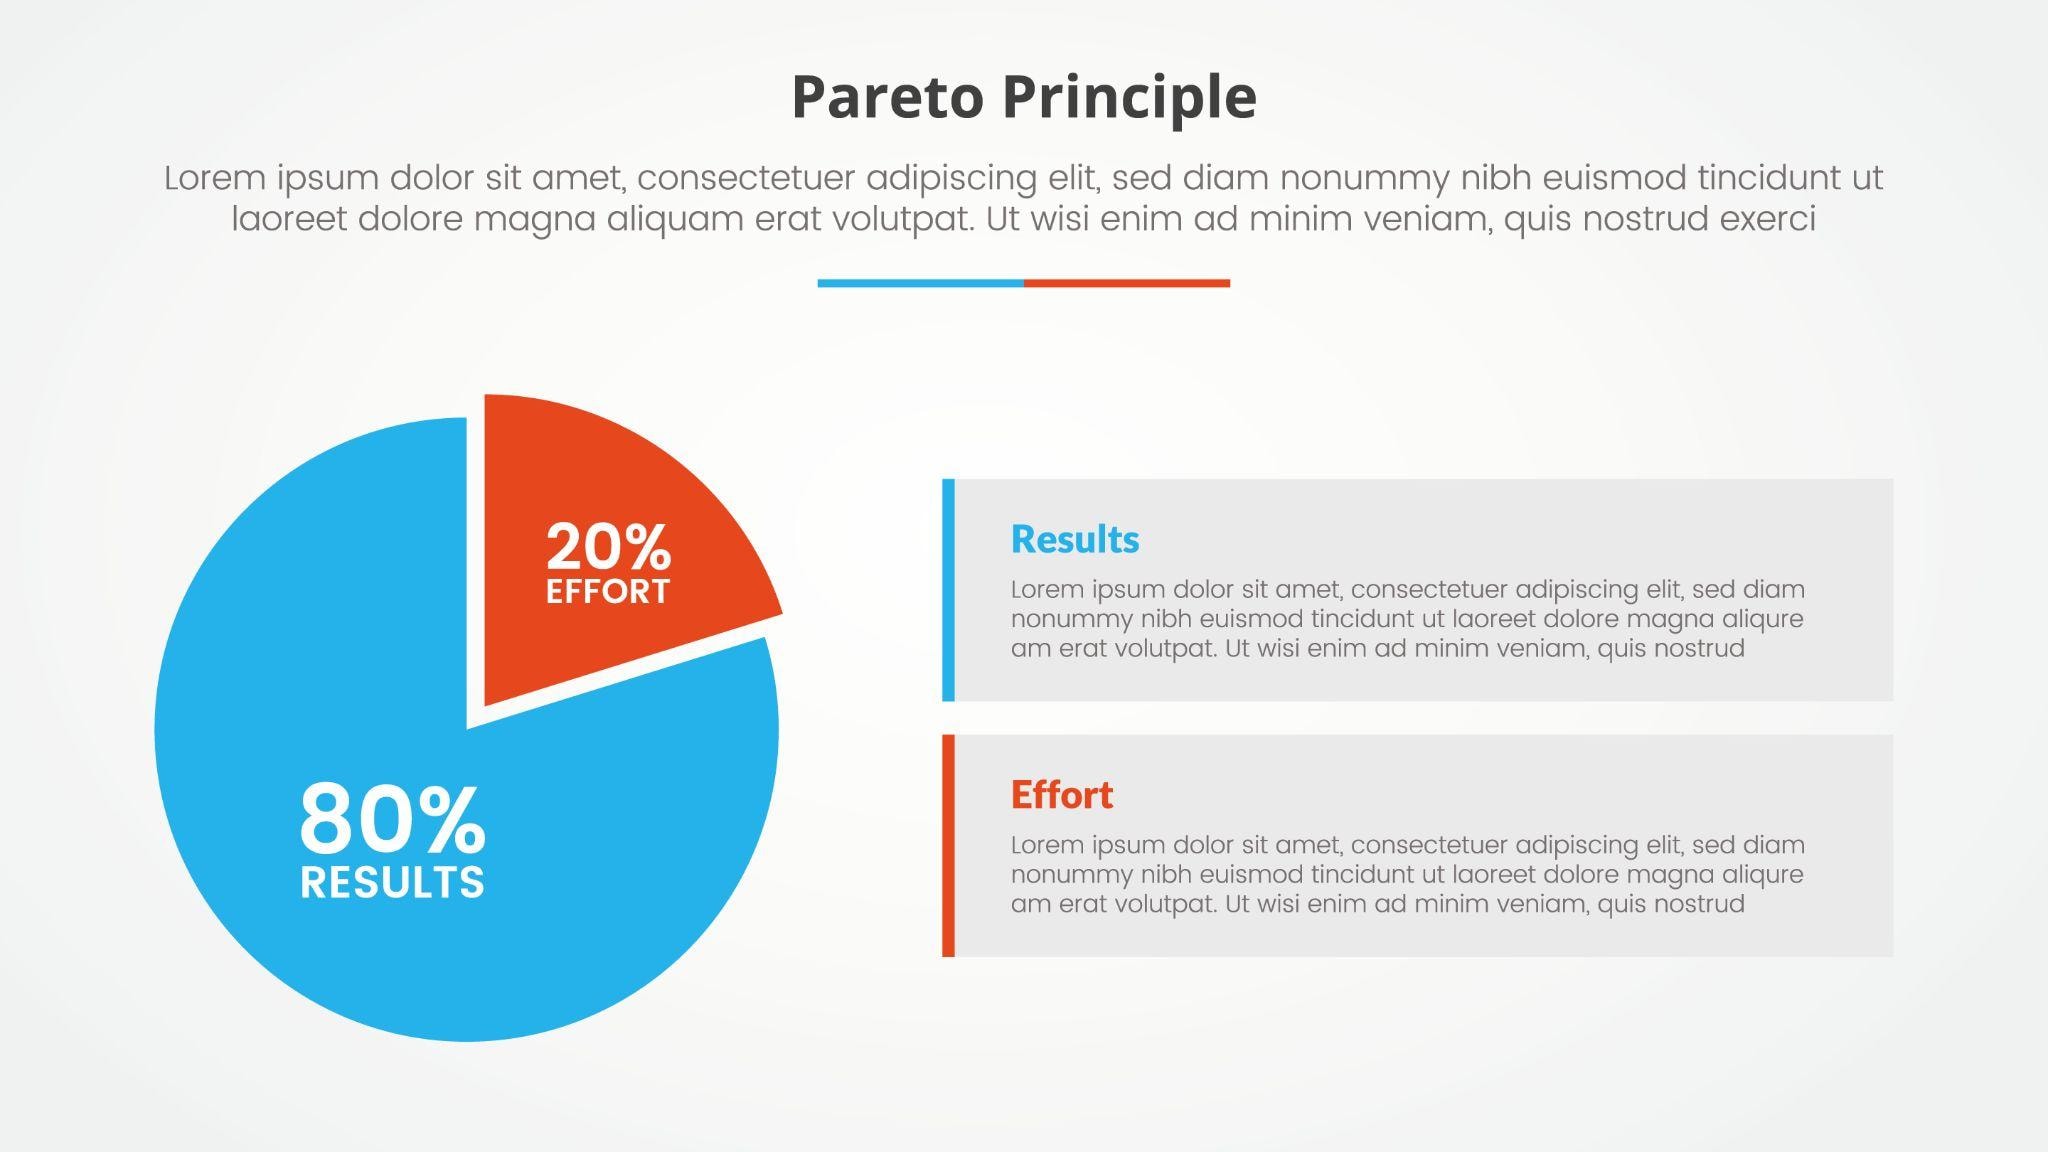
- Transform Complex Data into Digestible Stories: Static pie charts only show a final snapshot of data (e.g., "30% of sales come from Europe"). Animated versions, by contrast, unfold the data over time, turning raw numbers into a narrative. This is critical because humans process stories better than isolated facts.
- Boost Viewer Engagement and Attention: Studies (e.g., from the Journal of Educational Psychology) show that dynamic visualizations increase viewer focus by up to 30% compared to static graphics, as movement triggers the brain's natural tendency to track changing stimuli. Videos compete for viewers' limited attention spans (especially on platforms like TikTok, YouTube Shorts, or LinkedIn). Animated pie charts add visual dynamism that static charts lack, keeping audiences focused.
- Clarify Changes and Comparisons Over Time: One of the biggest weaknesses of static pie charts is their inability to show trends. Animated pie charts excel at illustrating how proportions shift—whether over months, years, or user actions.
There are many instances where pie charts can bring significant benefits, from simple school projects to complex business board meeting slideshows. That's why it's good to learn about the best video editing tool that offers data visualization features directly within the editor.
What is the Best Free Pie Chart Video Maker?
The short answer is Wondershare Filmora. The new animated charts feature can visualize your data by converting your structured Excel data into animated charts. In addition to that, you can add the built-in animated pie chart to videos easily and customize them with your own.
 secure download

You can work with percentages and absolute values, use abbreviations, pick a background color, add custom animations, edit chart headers, and we're only just scratching the surface. It also provides a lot of pie chart videos in its stock media, so you can add them to videos directly. The best part is that you can do all this without leaving the timeline.
- One tool, one look — Your charts inherit the typography and colors from the project, so titles, lower thirds, and slices feel like a cohesive design.
- Different Types of Animated Charts - Whether you are looking for pie charts, bar, donut, column, or area charts, you can find them in Filmora, and it also allows you to choose the theme modes, set the color palette, select the main fonts, and establish specific label rules based on your data.
- Real-time timing — You can trim the reveal to match voiceover pacing, add markers for story beats, and keyframes to add emphasis where needed.
- Various video editing features - As a powerful video editor, Filmora offers plenty of video editing features that can make your pie chart video stunning and attractive, including effects, filters, texts, and more.
How to Make Animated Pie Chart Videos in Filmora?
There are different ways to make animated pie chart videos. You can turn data into animated pie charts directly without coding or back-and-forth keyframe adjustments with Filmora's animated chart feature. You can also choose to add an animated pie chart sticker to videos. Let's see the steps.
Make an Animated Pie Chart from Data
- After downloading and installing Filmora on your computer, launch the software and start a new project.
- Go to Effects > navigate to AI Infographic > double click the Animated Charts to activate the feature.
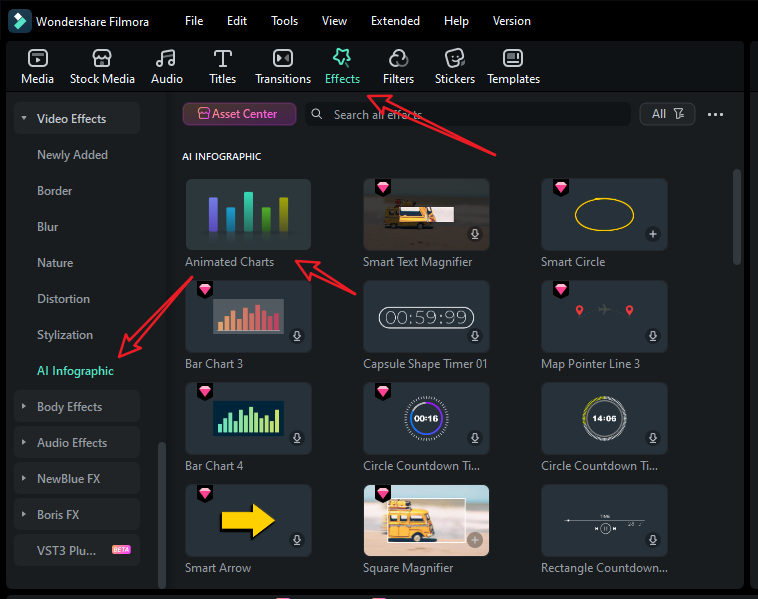
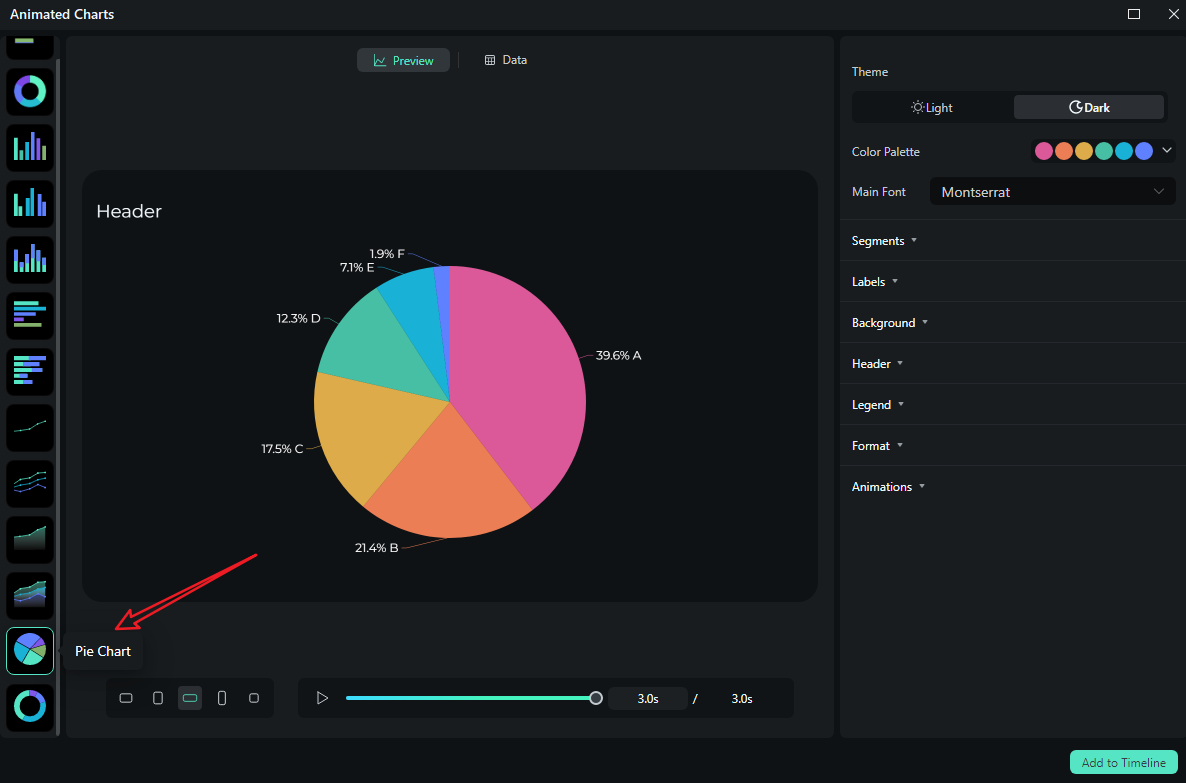
- View and pick an animated pie chart template on the left side.
- Switch to the Data section to upload your Excel file or edit the sample data column.
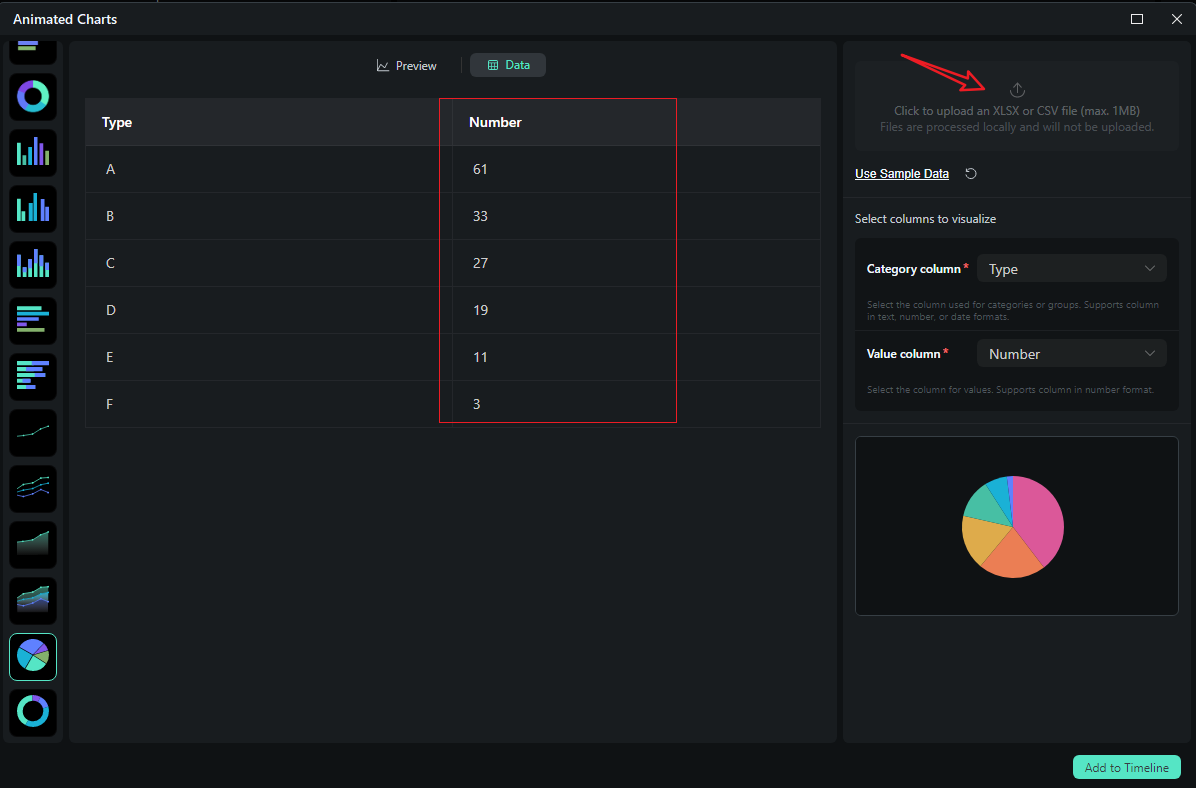
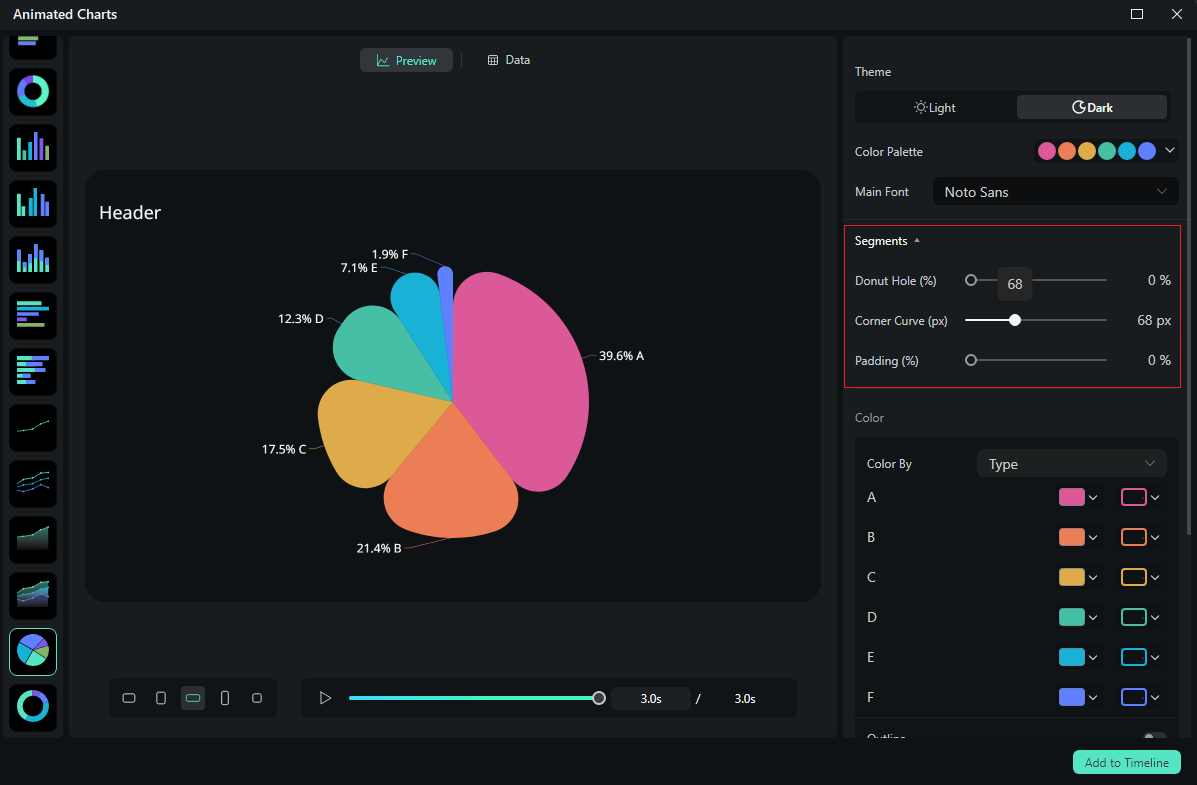
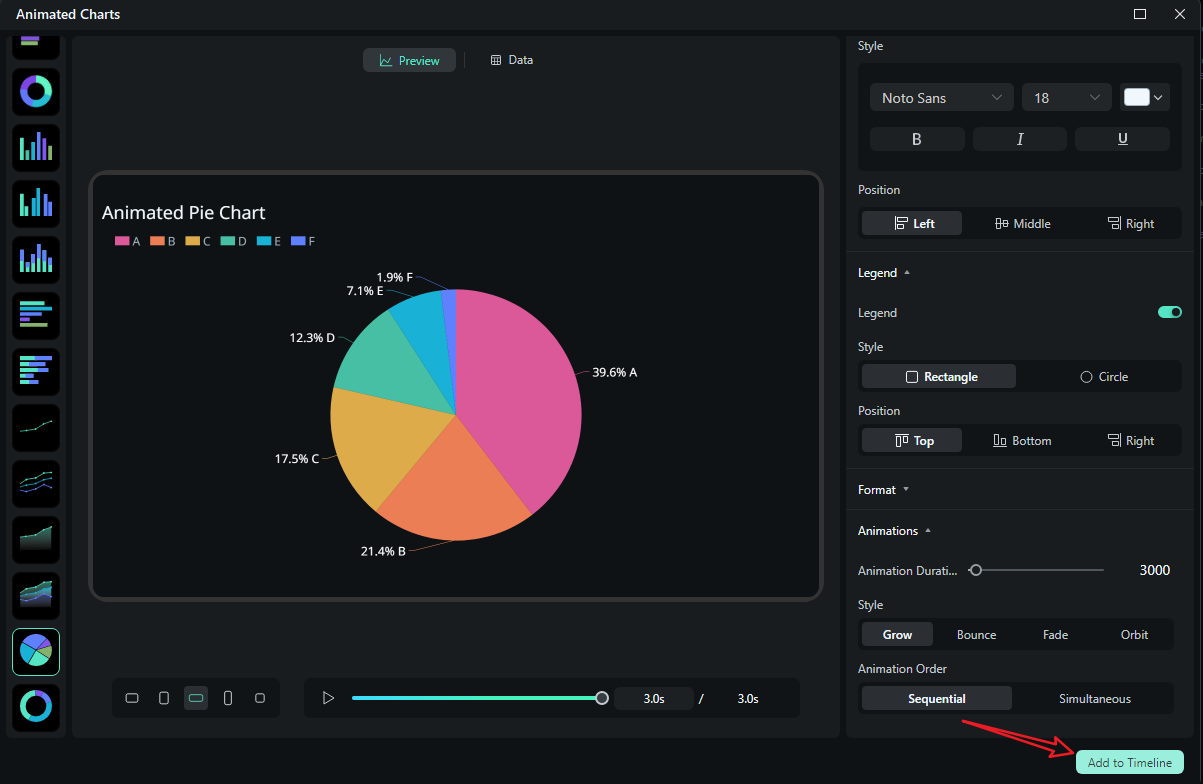
- After uploading the file or editing the data, review it and select what you want to visualize. Switch to the Preview section > you can adjust theme, main font, segments, labels, background, header, format, animation styles, animation orders, aspect ratio, and more accordingly.
- If you are satisfied with the result, you can click on add to the timeline.
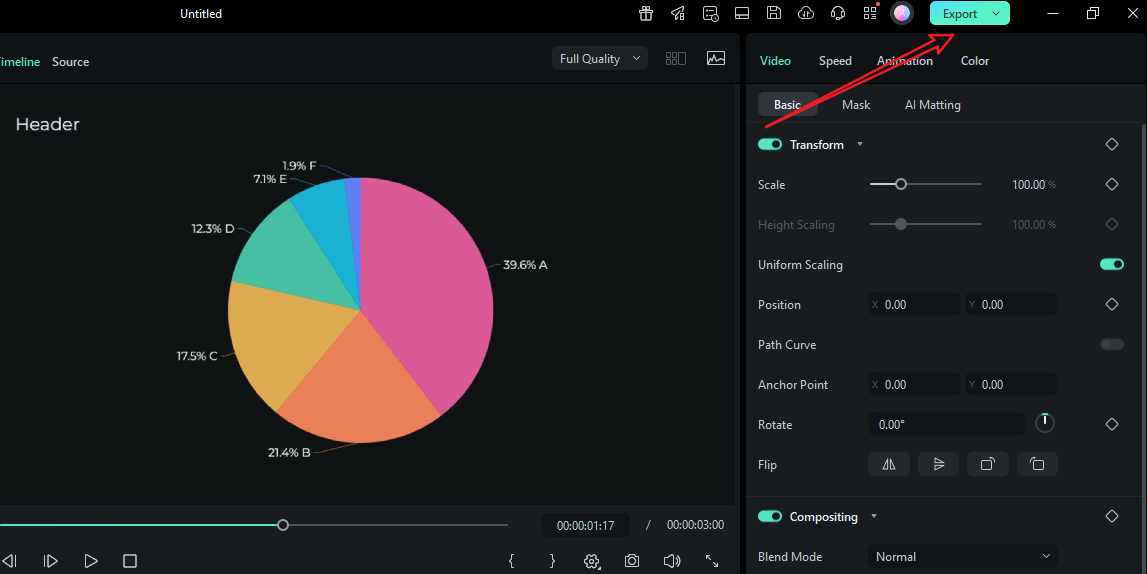
- Then you can choose to export the animated chart you have created.
Let's see the final animated pie chart video created by Filmora.
Add an Animated Pie Chart Sticker to Videos
Let's move on and see what Filmora feels like when you use it as a video editor with data visualization features. Just follow our simple guide, and you'll learn how to add an animated pie chart to videos with Filmora.
- Download and install Wondershare Filmora on your computer.
secure download
- Upload your video clip by clicking the import media button.
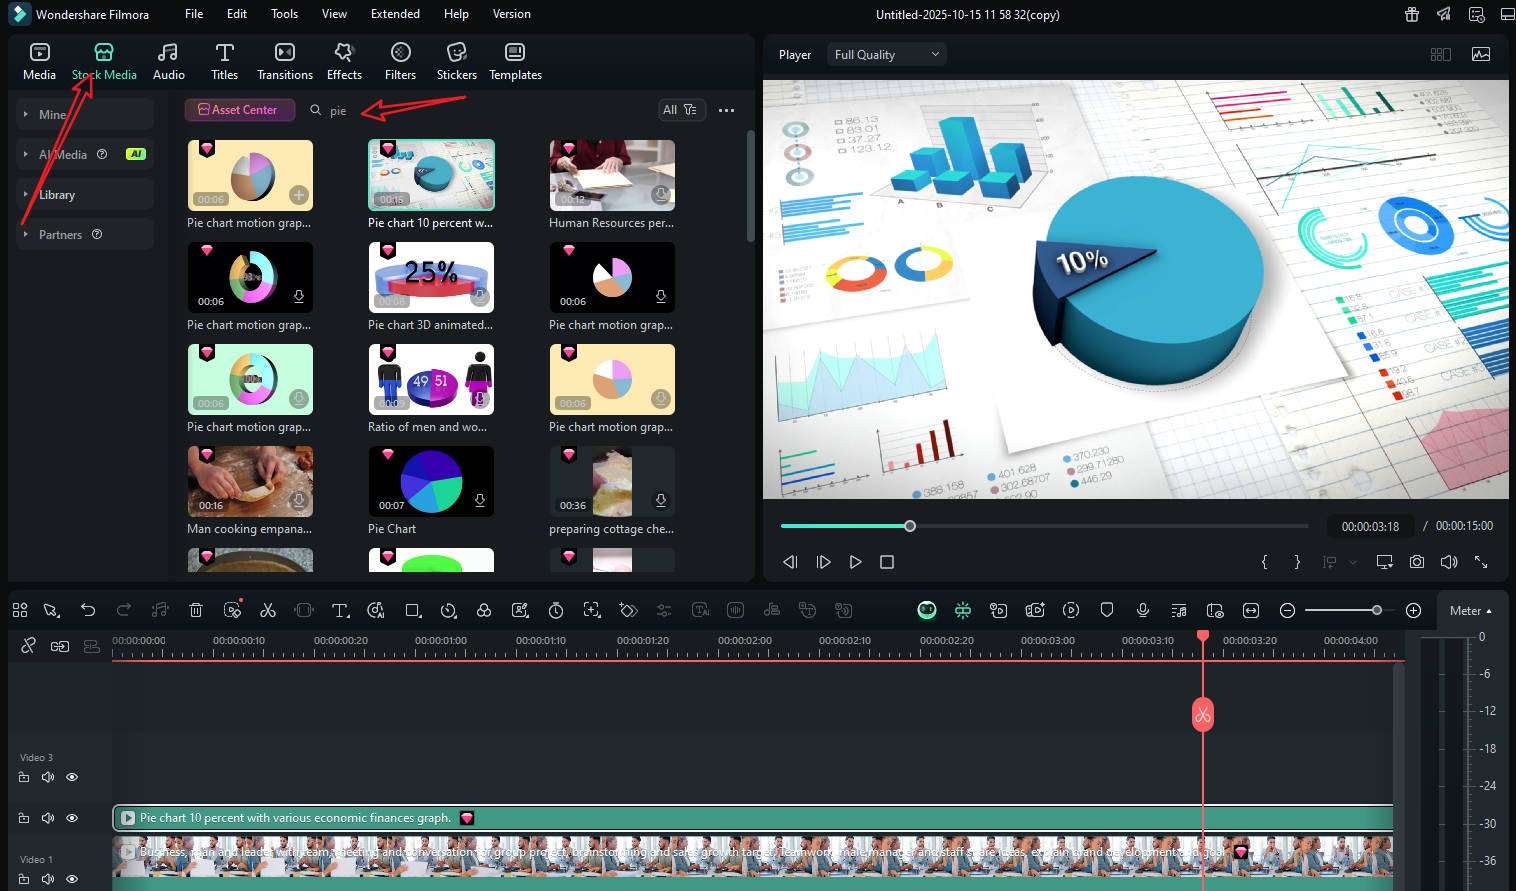
- If you want to add an animated pie chart footage to your clip, go to Stock Media> search for the keyword "pie chart"> choose the footage and add it to your timeline.
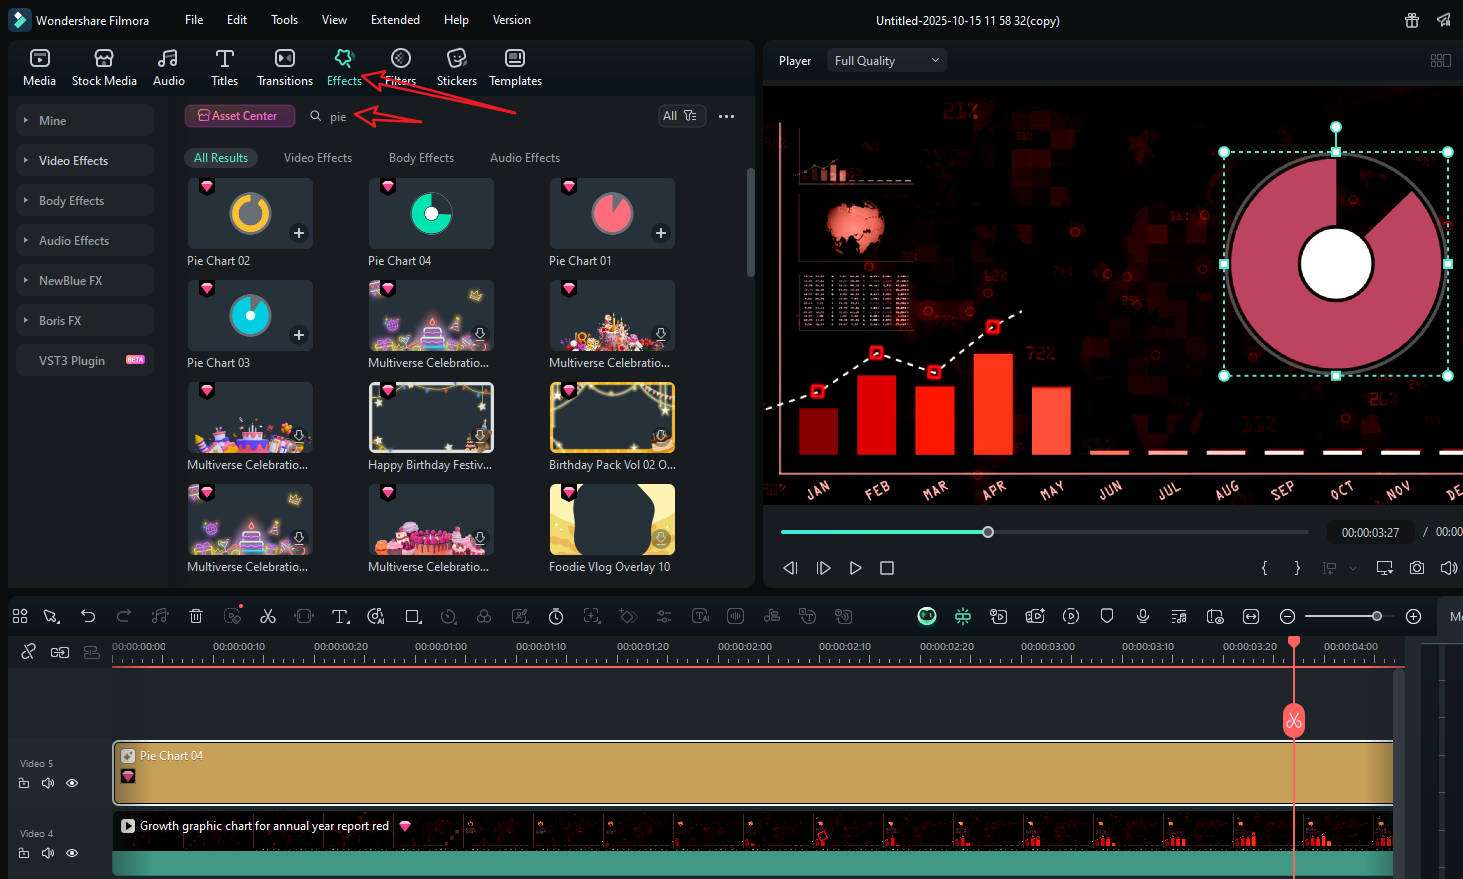
- Alternatively, you can go to Effects > tap in pie chart > pick and add an animated pie chart to your video.
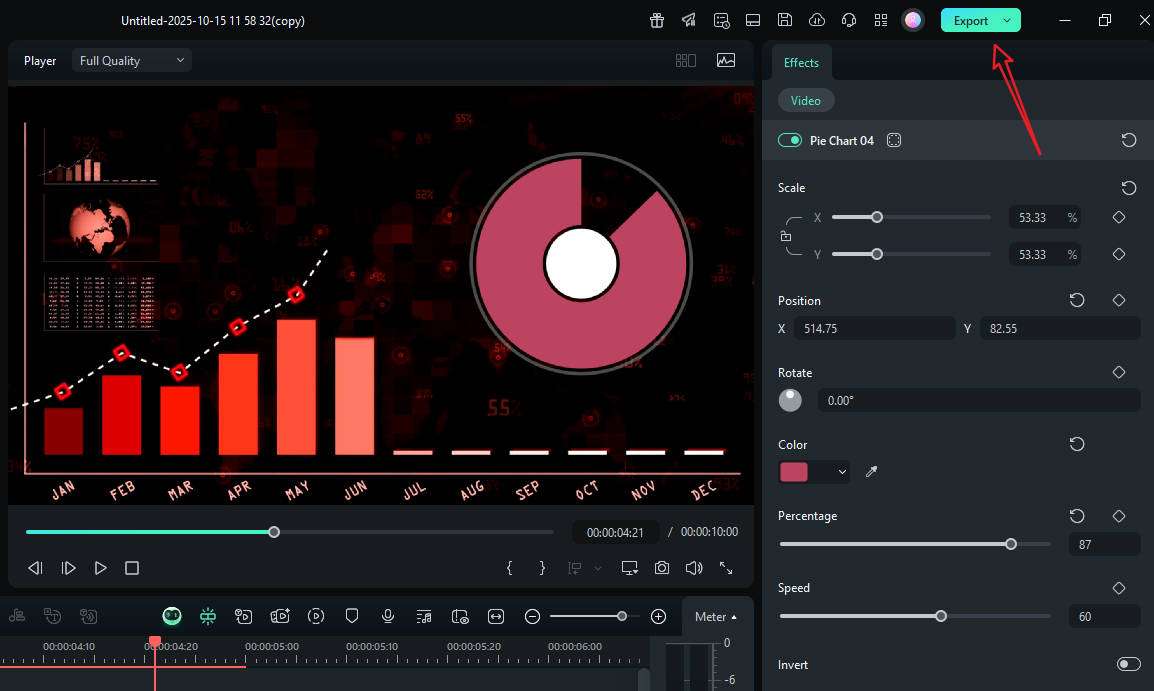
- Customize the chart with all available options. Preview the result and export it if you are satisfied.
Pro Tips for Making Effective Animated Pie Charts
Now that we understand how it works, let's consider some expert advice on how to utilize this feature to its best advantage.
- Limit slices (and group the rest). Four to six wedges in a pie chart would be the sweet spot. Anything below 4% and 6% can be grouped as Other. You don't want too many labels, as that might make the chart too confusing.
- Prefer direct labels to legends. If you have enough space, add labels directly on the pie chart. If you use legends, they force the eyes to constantly look around, while direct labels keep attention on the picture.
- Pay attention to the contrasts. Slices that are next to each other should differ in color and luminance. If your palette is monochrome, ensure you use tints and add thin separators to enhance clarity.
- Stage reveals in clean sequences. Introduce the shape first, then the labels, and finally, add emphasis, such as a soft glow or bounce on the key wedge.
Conclusion
Animated pie charts take the big idea in your numbers and present it clearly and concisely. They're fast to read, fun to watch, and perfect for videos where you have seconds to explain something complex. And, with Filmora's new chart tool, you can build, style, and time those pies without leaving the editor, and you can finally view your pie chart as part of the video editing process.
Download Filmora today and use it to prepare and showcase clean data with brand presets, with full freedom to drop animated pies into your next video in minutes.
secure download