100% Security Verified | No Subscription Required | No Malware


 ChatGPT
 Perplexity
 Gemini
 Claude
 Grok
Grok
As a visual content creator, have you ever wanted to show how some data relates to a greater whole without burying your viewers in labels? Well, the most tried and true way to do it is with a donut chart. It offers instant comprehension and a modern look, and if you add an animation, you will pull eyes exactly where you want them.
Let's define animated donut charts, show how they differ from pie charts, and learn how you'll create an animated donut chart and style them directly inside a powerful video editing tool.
In this article
What is an Animated Donut Chart?
An animated donut chart is a dynamic data visualization tool that combines the form of a donut chart, which is a circular chart with a hollow center, with animated effects. It is used to display the proportion of different data categories and can present data more vividly and interestingly through animation.
Animated Donut Chart VS Animated Pie Chart: What Are the Differences?
When we are talking about the difference between animated donut charts and animated pie charts, we should focus on the comparison between a standard donut chart and a pie chart. Once you can fully differentiate a donut chart and a pie chart, then you completely understand the difference between the animated ones.
| Aspect | Donut Chart | Pie Chart |
| Structure | Ring with a hollow center; room for a central label | Full circle; no interior space |
| Readability | Fewer collisions between labels; easier to annotate | Labels can crowd toward the hub |
| Visual tone | Minimal, modern; plays nicely over footage | Classic, bold; fills the frame |
| Best use | Part-to-whole with one headline metric (e.g., total) | Small category counts where "big slice" impact matters |
| Overlay use | Works well as PIP over video, thanks to negative space | Better full-frame unless labels are kept simple |
How to Make an Animated Doughnut Chart in Videos?
Before you make an animated doughnut chart, you should pick a doughnut chart maker. There are many free donut chart makers online, like Canva and Figma, which allow you to make static charts and share them. But if you are looking for a more direct way to add a doughnut or other charts to videos, the best tool is Wondershare Filmora.
 secure download

It issues a new feature named animated charts, which takes the game to a new level by implementing a standalone feature that deals with data visualization. You can simply import a spreadsheet and convert it into an animated donut chart, but you can also explore other chart types like pie, bar, column, area, and more.
The best part about it is that Filmora offers a lot of customization features, so you won't have to hop between different tools to get the job done. Consider the top features that make Filmora stand out as the best video editing tool for adding animated donut charts to videos.
- Select the Theme: Start with a base that matches your brand. Dark donuts over footage feel cinematic, while light themes shine in tutorials.
- Adjust the color palette: Assign brand colors or pick a cool palette with adequate contrast between adjacent slices.
- Edit and change font: Consistent typography across all your visuals will improve your brand identity and give your videos a professional look.
- Use precise slice and label rules: The information provided in the pie chart must be easily understandable across devices.
- Pick a background color and opacity: Choose a subtle panel or set the transparency for a PIP effect in your footage.
- Insert animations: You can fully control sweep directions and speeds to match the beat of the video.
With all that in mind, let's see Filmora in action. Follow this easy tutorial to create an animated donut chart in your video from a simple spreadsheet.
- Download and install Filmora on your Windows or macOS device. And start a New Project.
secure download
- Go to Effects > navigate to AI Infographic > double click the Animated Charts to activate the feature.
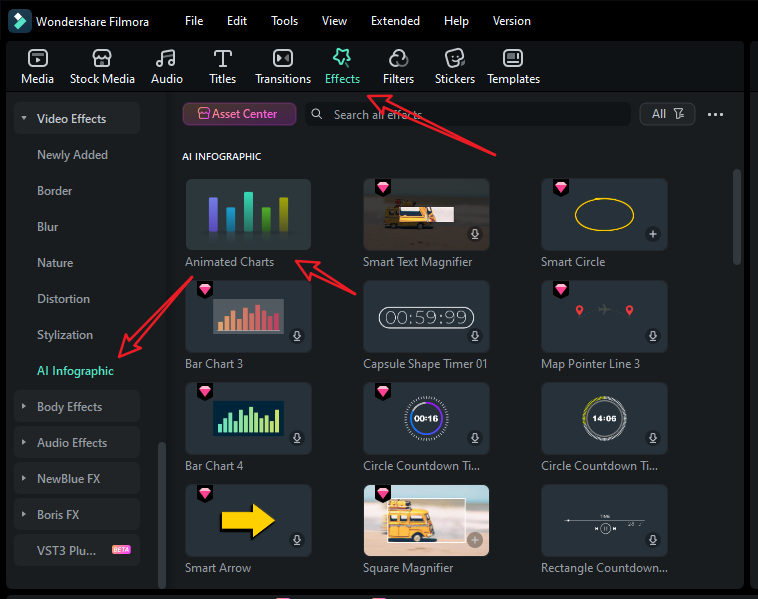
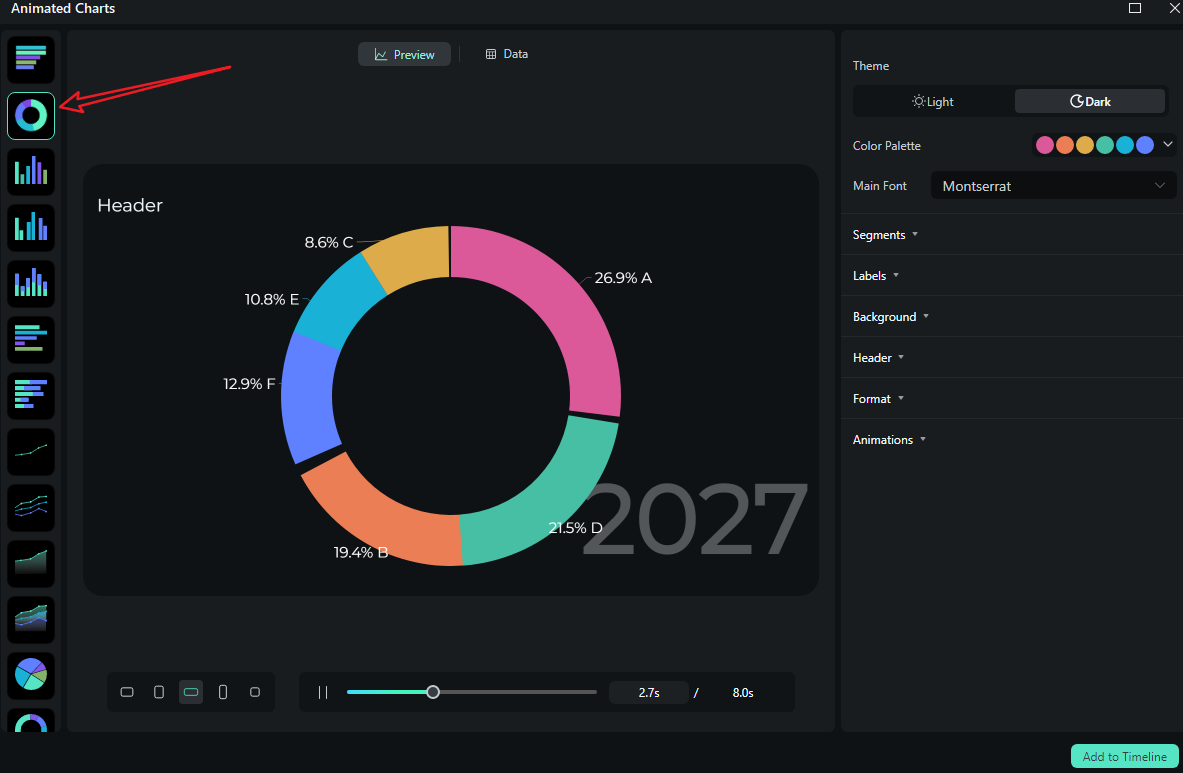
- View and pick an animated donut chart template on the left side.
- Switch to the Data section to upload your Excel file or edit the sample data column.
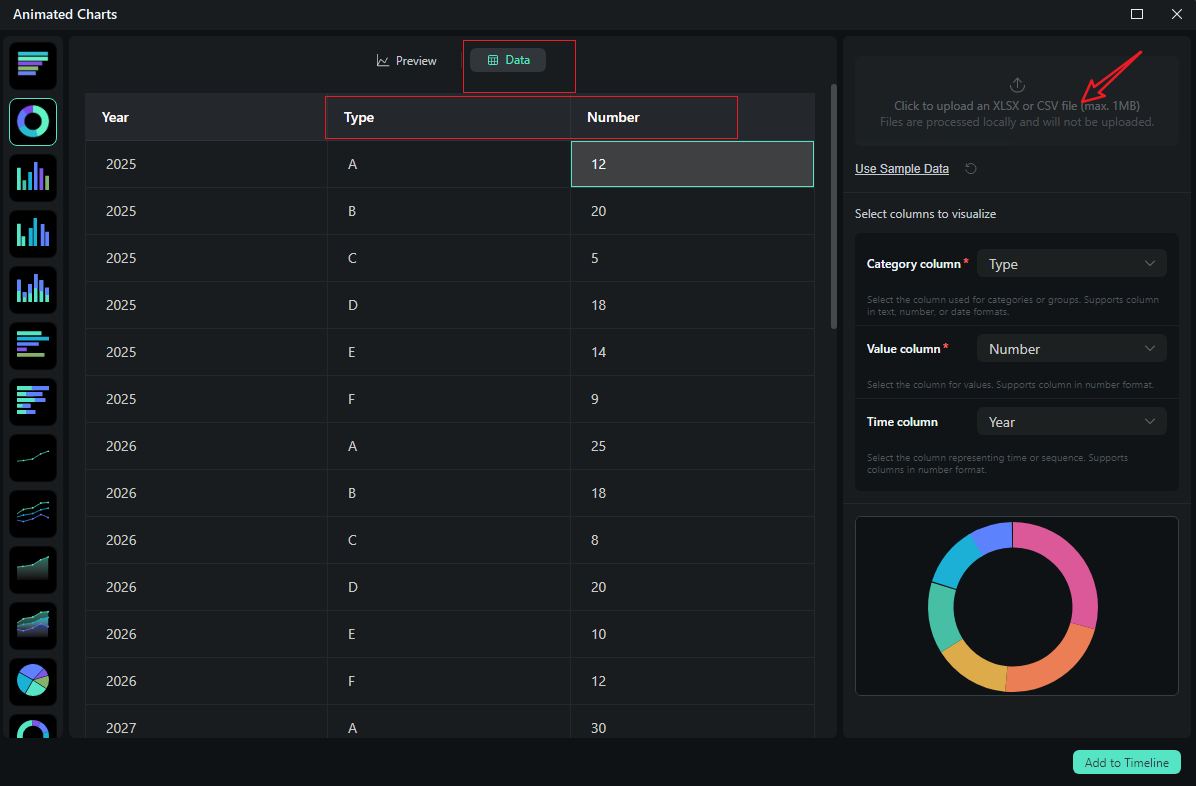
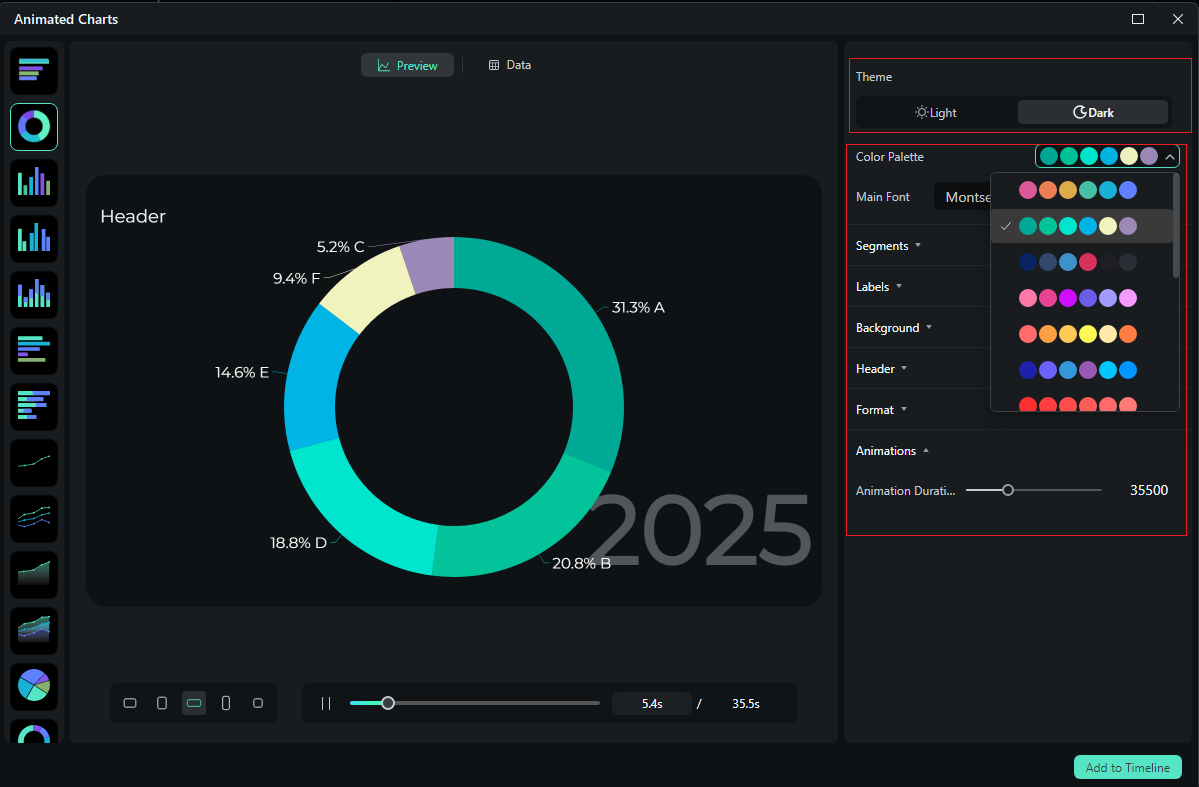
- After uploading the file or editing the data, review it and select what you want to visualize. Switch to the Preview section > you can adjust theme, main font, segments, labels, background, header, format, animation styles, animation orders, aspect ratio, and more accordingly.
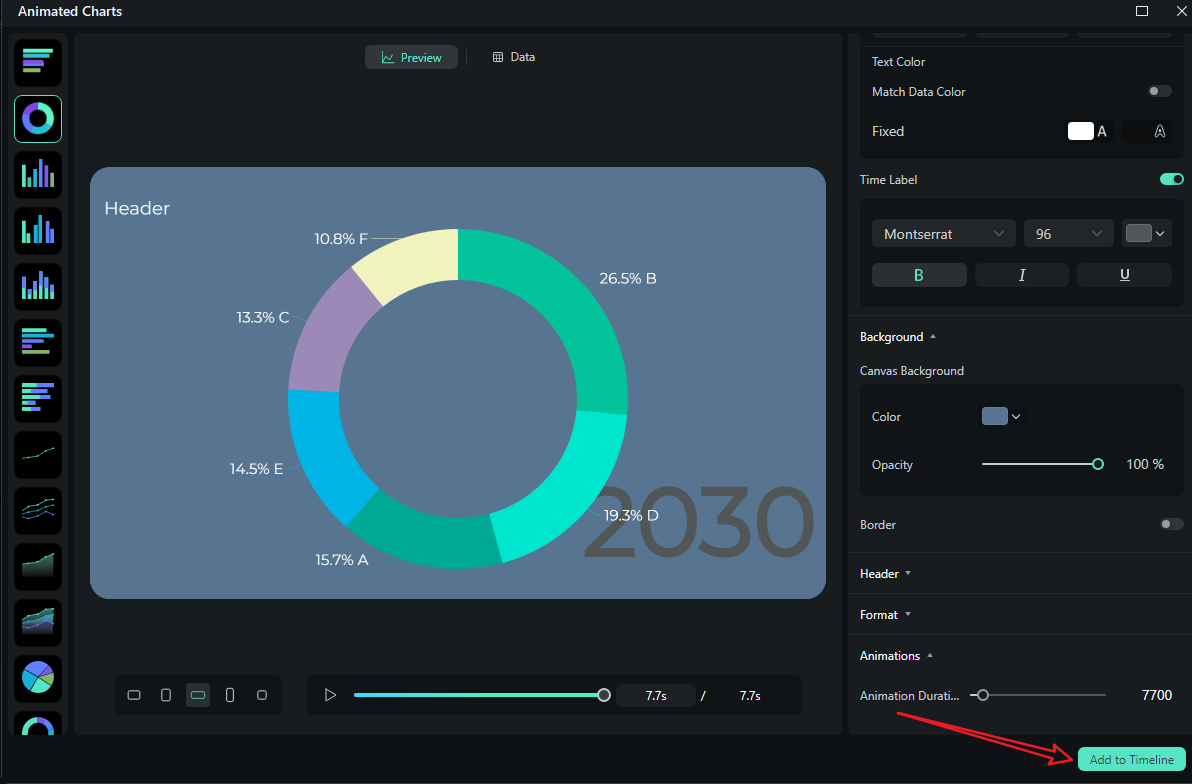
- If you are satisfied with the result, you can click on add to the timeline.
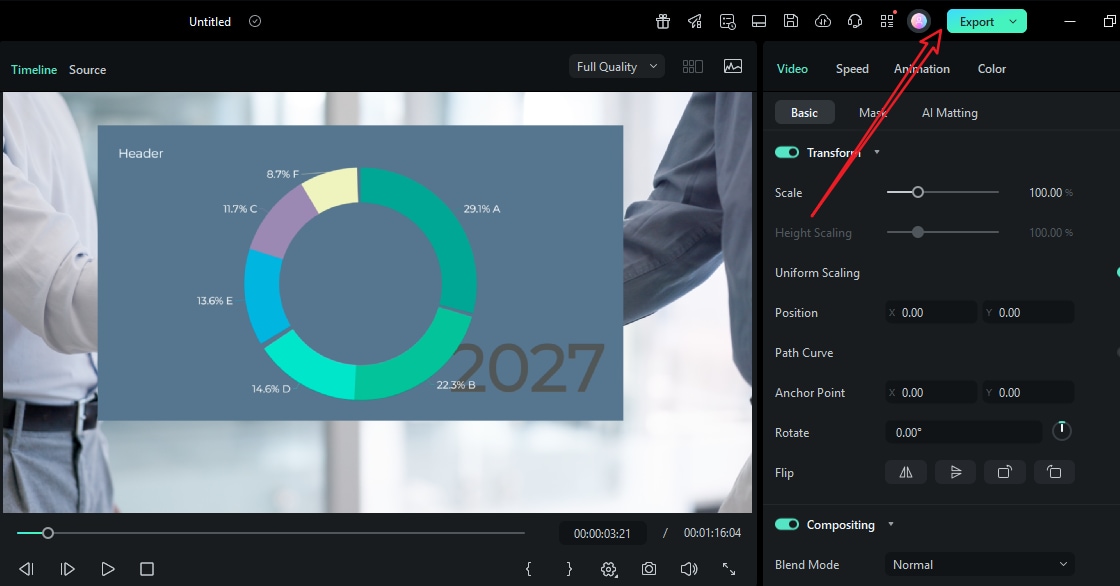
- Then you can choose to export the animated chart you have created.
Let's see the final animated donut chart video created by Filmora.
Conclusion
Donut charts are trendy, you can read them quickly, and they fit well over videos. When they move in sync with your story, they guide attention instead of demanding it. Filmora's new chart maker feature gives you the power to create powerful charts within your video editing workflow. If you post data-driven videos frequently, this feature will save you a ton of time.
Download Filmora today and see why it is considered the best video editing tool for any type of video that deals with data analytics.
secure download