100% Security Verified | No Subscription Required | No Malware


 ChatGPT
 Perplexity
 Gemini
 Claude
 Grok
Grok
Wouldn't you agree that infographics have always been a smart way to turn complex ideas into clear and compelling visuals? But what if you could take it a step further? You can powerfully enhance your content by turning static infographics into dynamic infographic videos.
Videos not only make information easier to absorb but also help your audience stay focused and engaged. Whether explaining data, telling stories, or sharing tips, a well-crafted infographic video can convey your message more effectively than static visuals alone.
In this article, we'll cover some of the most impressive examples of infographic videos ever created and show you how to quickly and easily make your infographic videos using AI tools. Let's get started!

In this article
Part 1. 10 Infographic Video Examples for Your Reference
Since we've seen how turning infographics into videos can make content more powerful, let's look at some real examples. These infographic videos do a great job of making complex ideas easy to understand while keeping viewers interested with clear visuals and good storytelling. Here are some of the best ones to learn from:
How the Stock Exchange Works by Kurzgesagt
Kurzgesagt is known for its well-animated educational content, and this infographic video example is no exception. It explains the structure and purpose of stock exchanges using rich animation, a sense of humor, and a clear step-by-step approach.
History of The Internet by Life Noggin
This infographic video traces the history and growth of the internet using animated charts and graphs, it helps viewers understand the rapid expansion of data and connectivity in a visual format. The video is informative, clear, and visually striking.
Bitcoin explained and made simple by The Guardian
A clear and concise infographic video that explains what Bitcoin is, how it works, and why it matters. Its fast pace, design, and sound make it ideal for fast digital consumption.
Causes and Effects of Climate Change by National Geographic
The infographic video by National Geographic explains the science behind climate change through engaging and approachable animations. National Geographic's use of storytelling, combined with motion design, makes complex environmental data easier to understand.
What is IoT animation by Mercku Connectivity
Using colorful animations and straightforward narration, this animated infographic video makes the concept of IoT accessible to non-technical viewers. It's a strong example of how visual storytelling can make emerging technologies easier to understand.
The State of Wikipedia by JESS3
Created by JESS3, this infographic video celebrates Wikipedia's 10th anniversary by visualizing its growth and global impact. The video combines dynamic animation with engaging storytelling to highlight the platform's collaborative nature. It's a standout example of using infographics to convey an organization's history and influence.
What is HIPAA? HIPAA Basics Training by Health Compliance Pros
This infographic video provides a simple explanation of what HIPAA is and why it matters. It uses clear visuals and easy-to-follow narration to explain the healthcare privacy rules. This video shows how animated infographic videos can make complex topics easier to understand.
What is Change Management? by Project Management Institute
The Project Management Institute's infographic video provides a clear overview of change management, outlining key models and strategies for navigating organizational change. Through engaging visuals and straightforward explanations, the video simplifies complex concepts, making it accessible to professionals and students.
Tracing the thoughts of a large language model by Anthropic
An infographic video explains how Claude works. With simple visuals and clear narration, the video shows how Claude understands information, plans answers, and does things like guessing rhymes in poems or changing ideas into other languages. It outlines difficult AI ideas so everyone can understand them.
The surprising pattern behind color names around the world by Vox
Check out this infographic video from Vox that looks at a surprising pattern in how languages name colors. Around the world, many languages create color words in a similar order. They usually start with black and white, then red, green, or yellow. This pattern gives clues about how people see and understand color. The video uses clear pictures and simple narration to explain the idea so everyone can follow along.
Part 2. Creating Your Own Infographic Video Using AI-Powered Tools
After exploring some incredible infographic video examples, you might be wondering how to create your own. Luckily, with tools like Wondershare Filmora, crafting a high-quality infographic video is simpler than you might think, especially if you're short on time or not a professional video editor.
 secure download

Whether you're a beginner or an experienced video creator, Filmora offers a range of intuitive and interesting features to help you turn your ideas into a visual story. From ready-made templates to advanced editing tools like motion tracking, keyframe animation, and smart cutout, Filmora has everything you need to get started quickly.
Visualize Your Idea in a Video
Filmora also features an Animated Charts tool that makes it easy to bring your concept into an infographic video. Simply input the information you want to convey, and Filmora will create a video layout that matches your vision. You can choose from different styles, like a clean and realistic look, playful comic animations, or a more professional approach, depending on your message and audience.
Step-by-Step: How to Create a Video from Your Idea
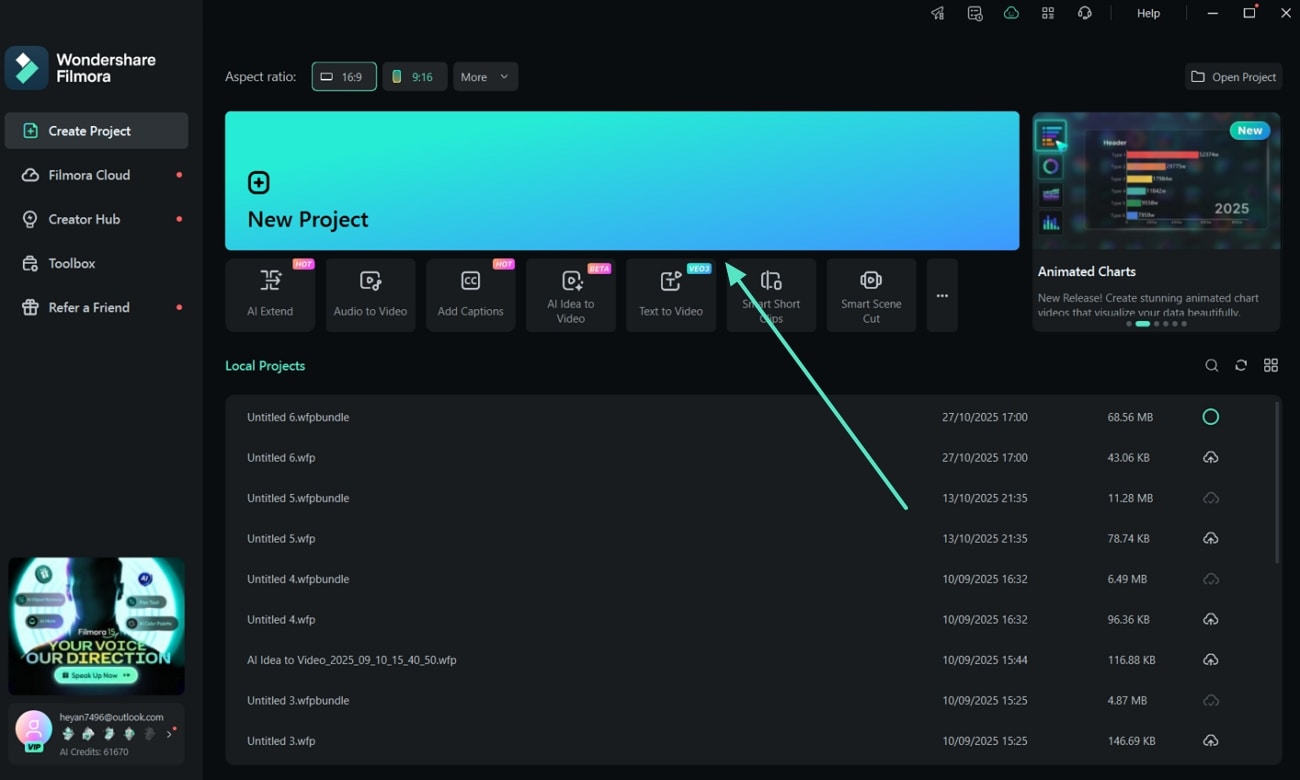
Step 1Launch Filmora and Start a New Project
Open Filmora and click New Project from the startup window to begin creating your AI-powered infographic video.
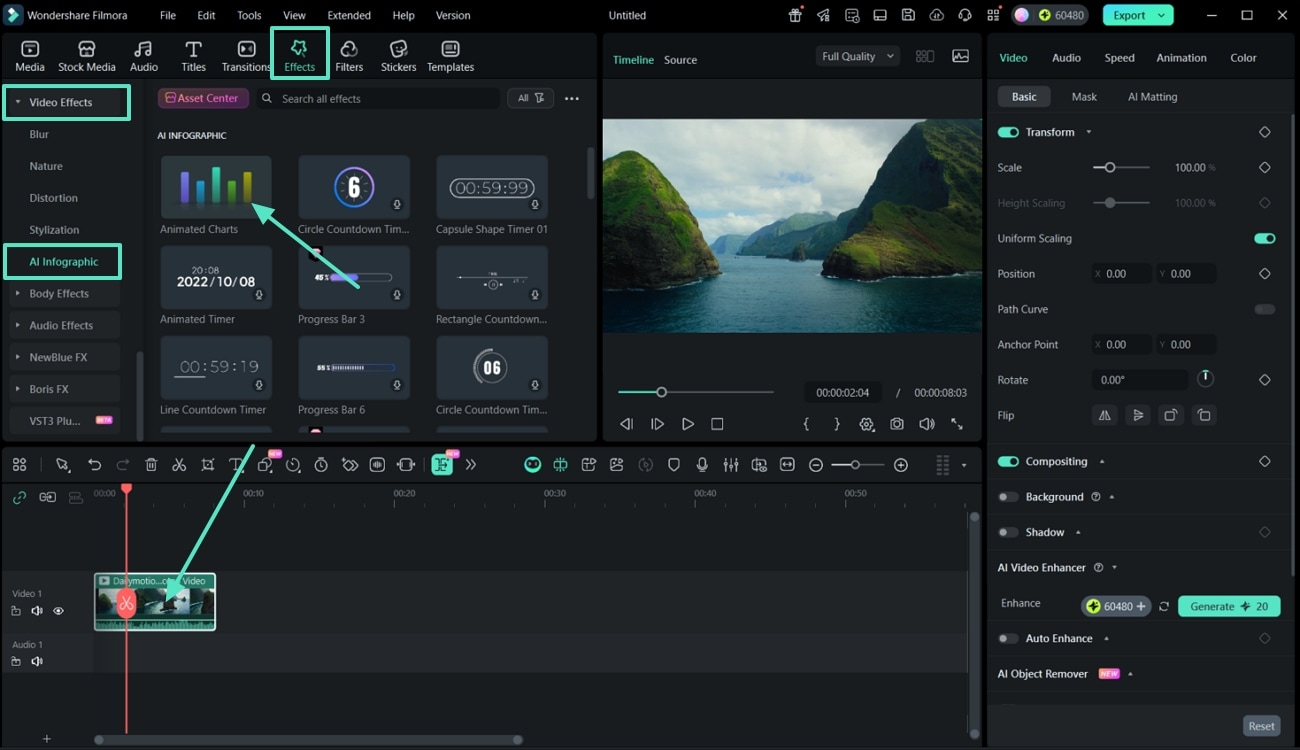
Step 2Access Animated Charts in the AI Infographic Section
Go to the Effects tab on the top toolbar, then select Video Effects > AI Infographic > Animated Charts from the sidebar to access the available templates.
Step 3Choose a Chart Type and Import Data
In the Animated Charts window, select your preferred Chart Type and head to the Data section. Import your data file, then edit categories, values, or time columns as needed.
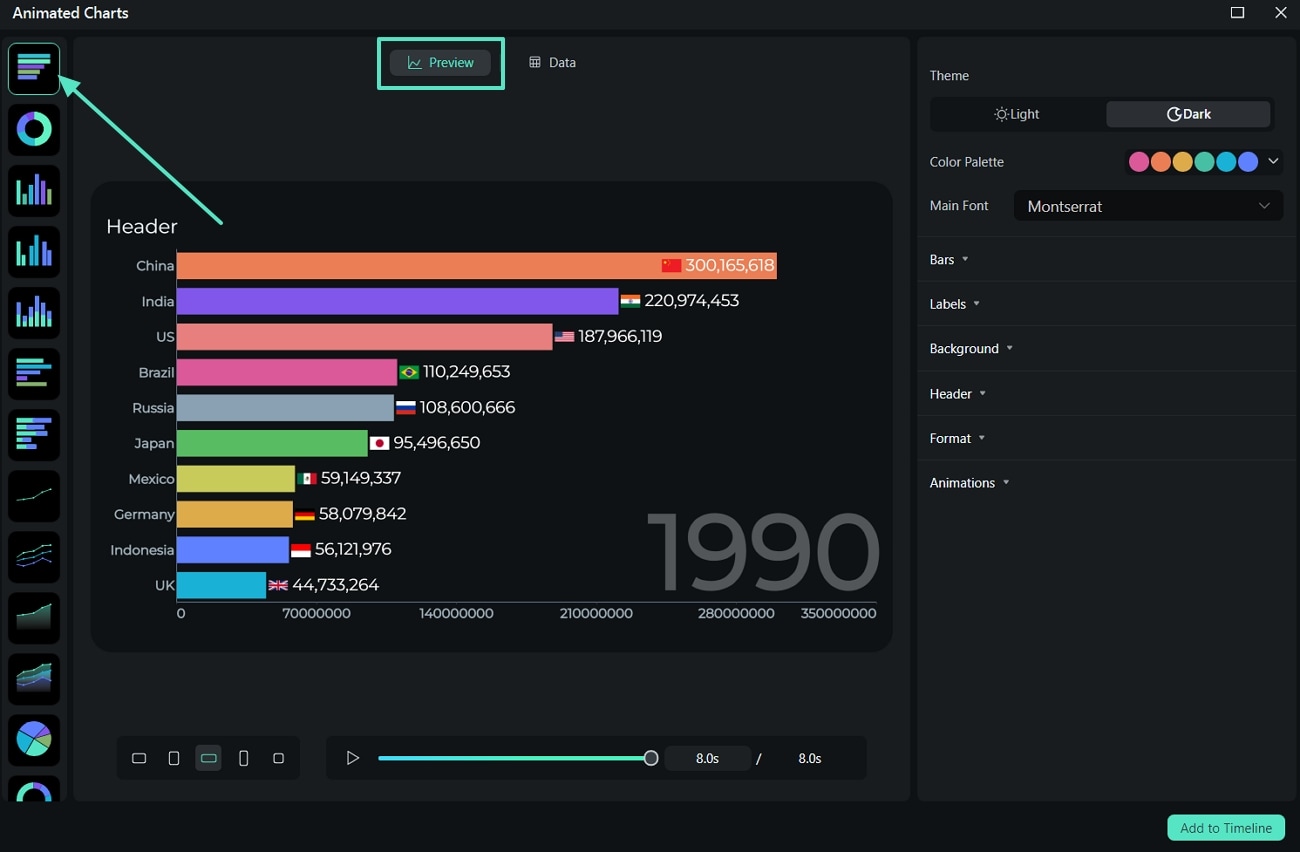
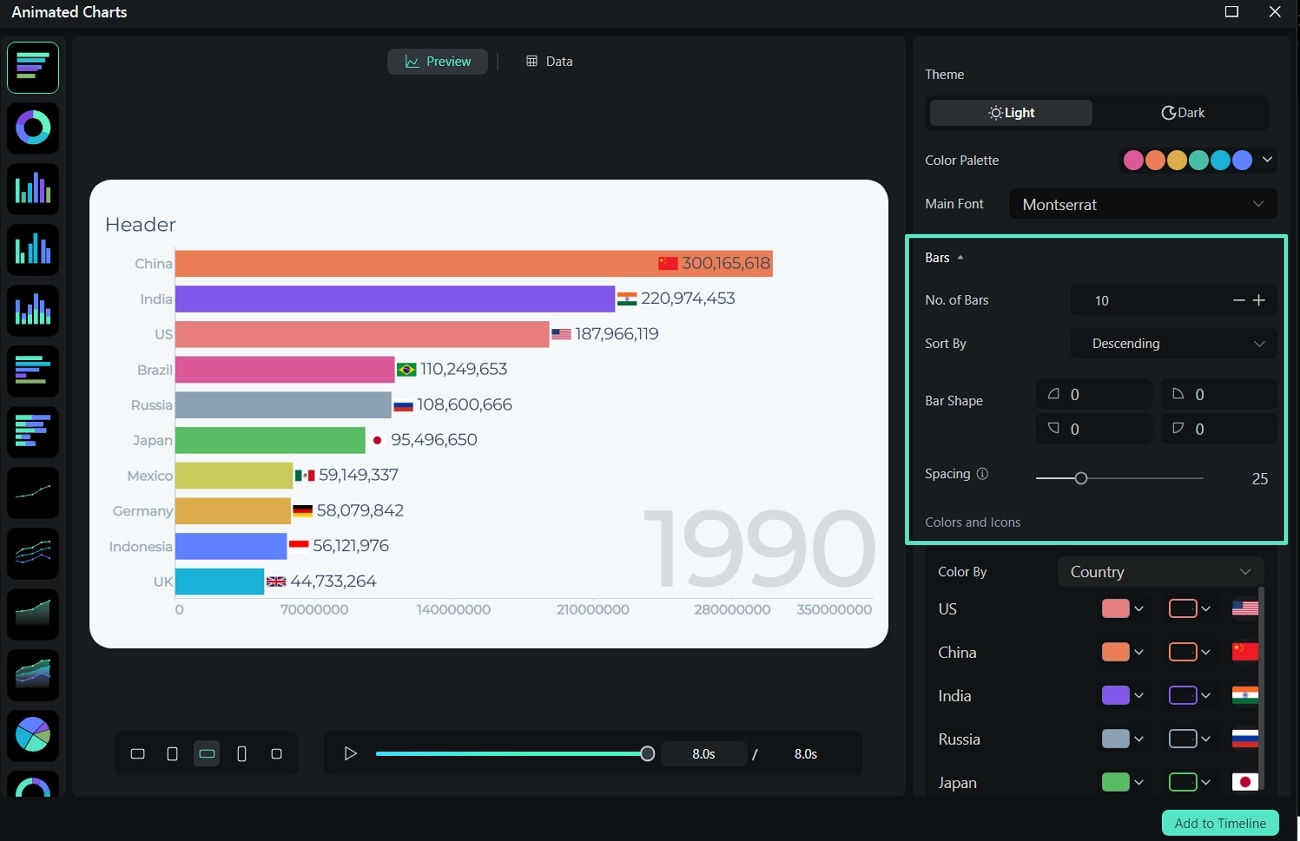
Step 4Customize the Chart Style and Design
Adjust the Aspect Ratio, Theme, Color Palette, and Font to match your video style. You can also modify Bar Shapes, Colors, and Spacing for a clean visual look.
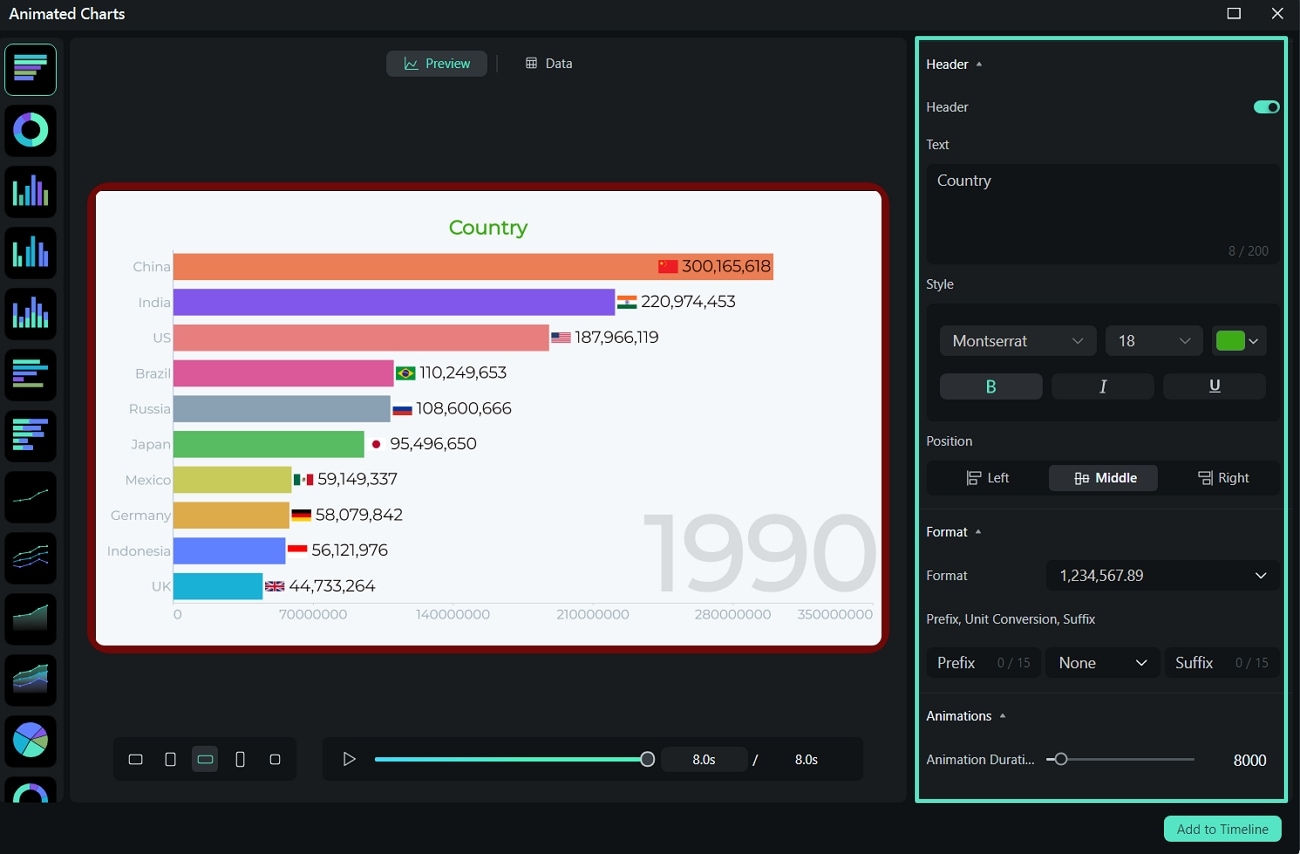
Step 5Edit Labels, Background, and Header
Refine your chart by adjusting Label Positions, editing Axis and Time Labels, and changing the Background or Border settings. You can also enable and edit the Header text for a professional finish.
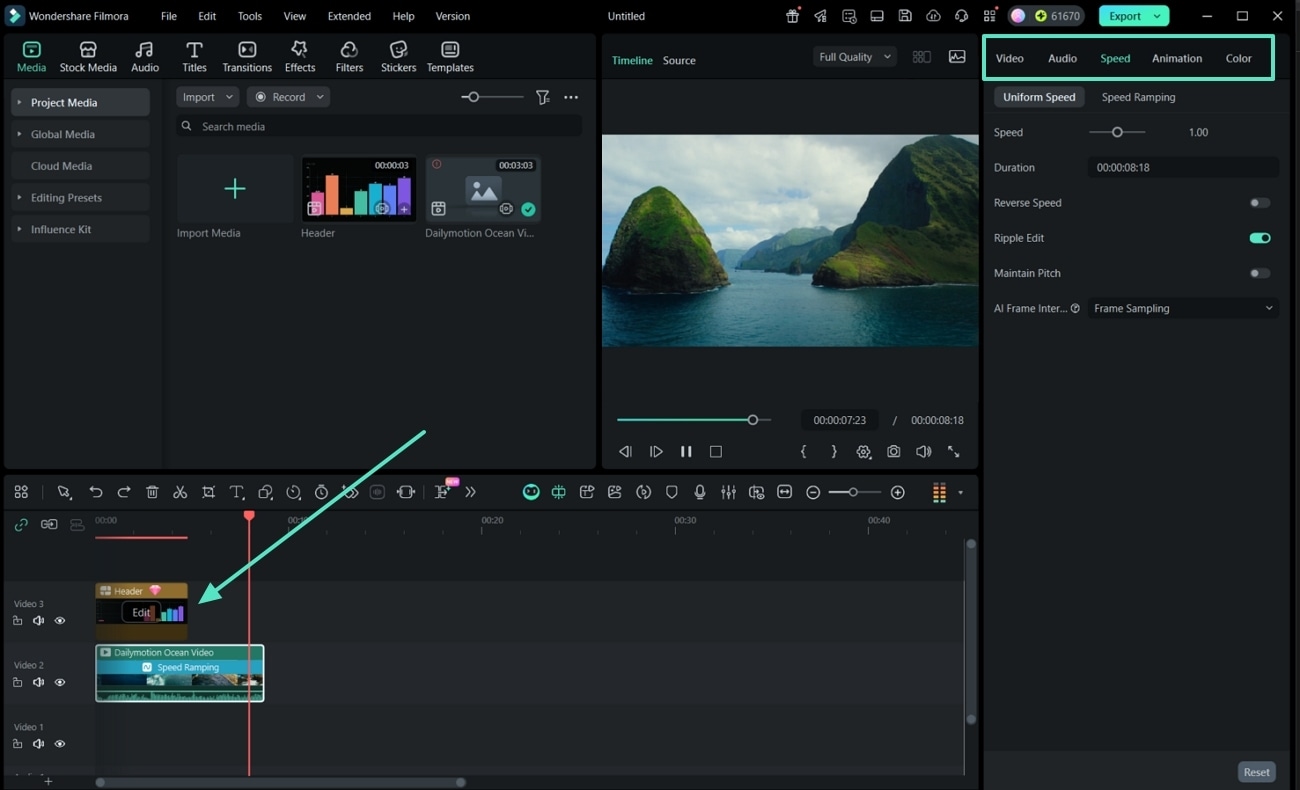
Step 6Add to Timeline, Preview, and Export
Click Add to Timeline to insert your animated chart into the video. Fine-tune visual parameters, preview your project, and finally hit Export to save your AI infographic video.
Add Voice-Over or Background Music
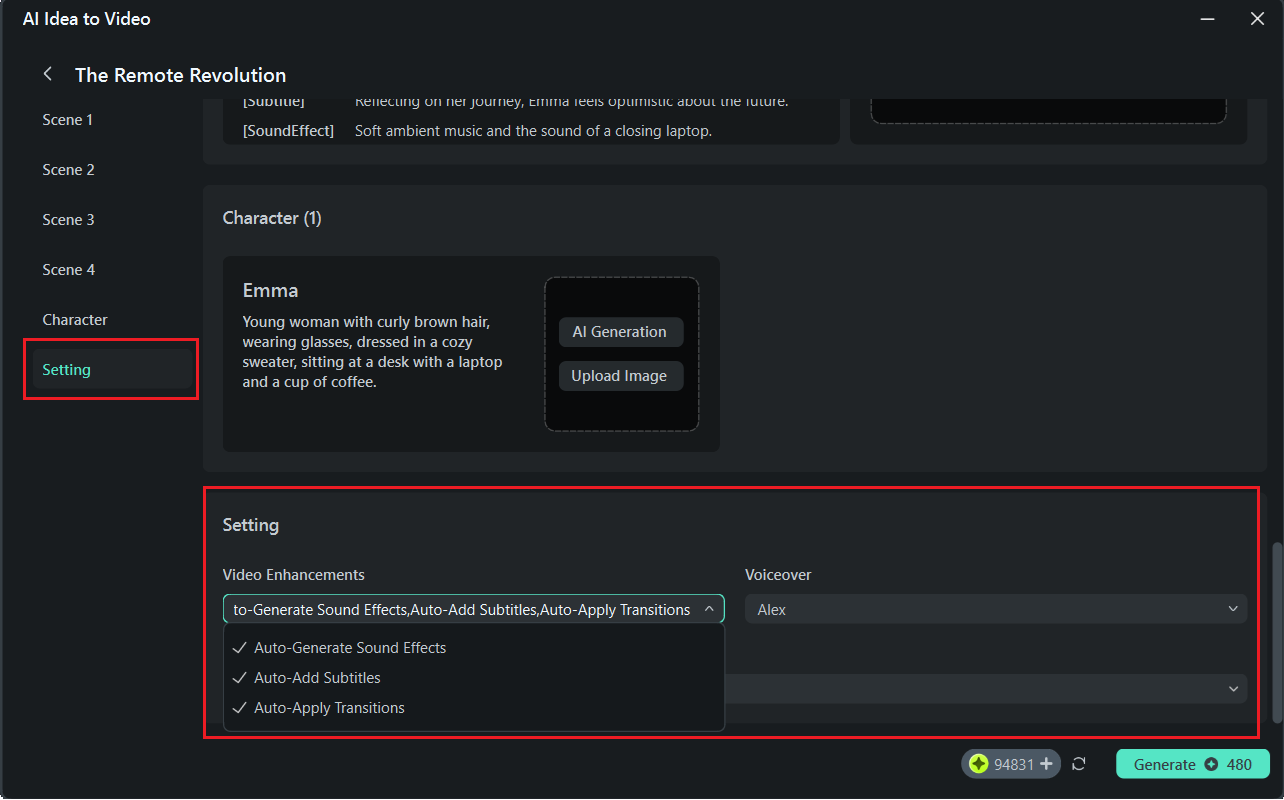
Next, you'll likely want to add a voiceover and subtitles to explain your infographic video. No worries, it's already included in the AI Idea to Video. You only need to choose a voice, decide if you want to include subtitles automatically, and add other elements like sound effects and transitions to enhance your video.
- Filmora makes it easy to add voiceovers and subtitles. Select a voice that fits your video, and subtitles can be added automatically.
- To adjust the look and sound, go to the Settings section and choose your video quality, voiceover style, and aspect ratio.
- You can also add music, sound effects, and transitions to make your video fun and interesting. Filmora gives you lots of easy options to use.
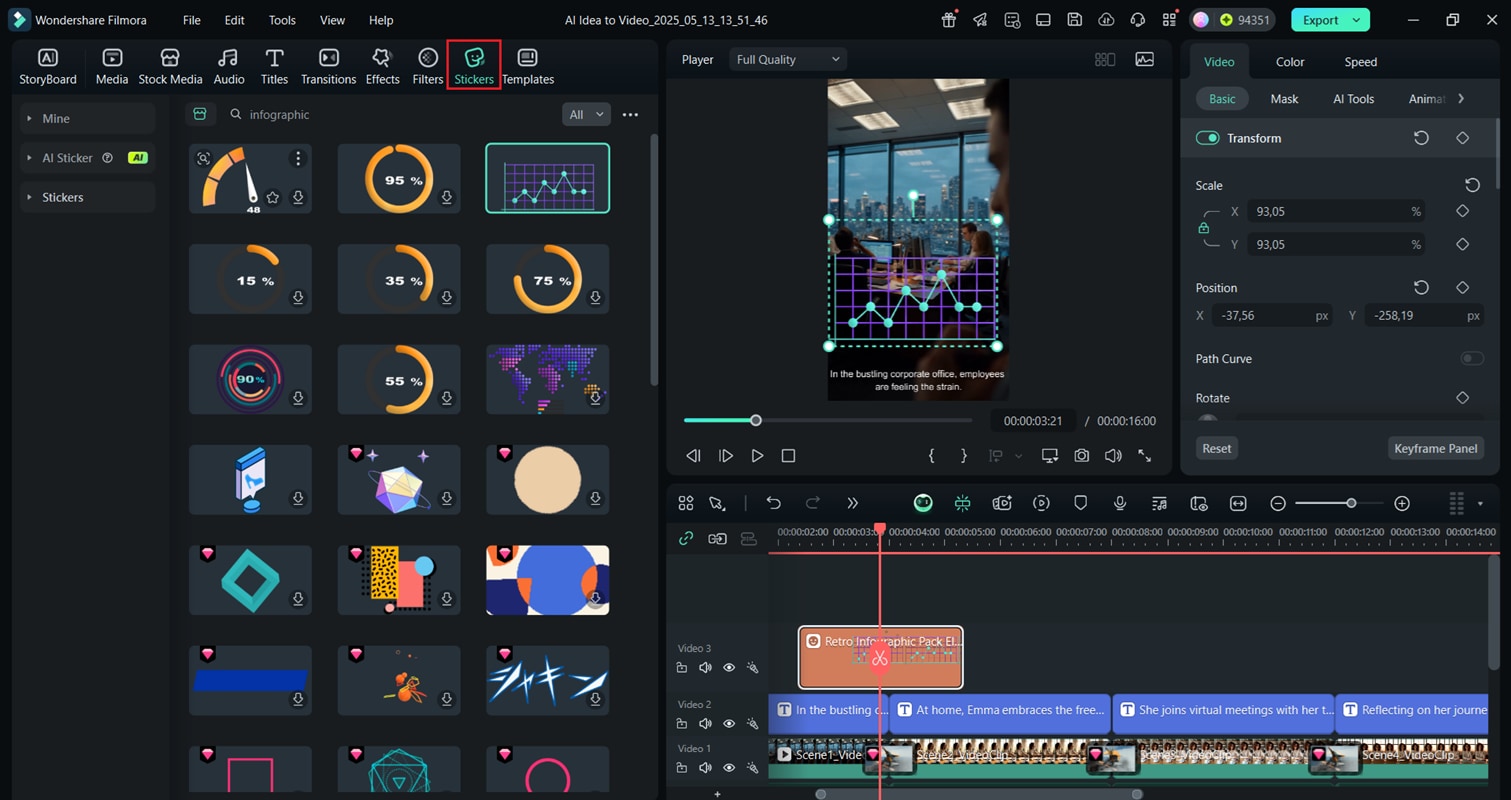
Enhance Your Infographic Video with Stickers and Text
To add a little extra touch, you can use Stickers to insert visual elements such as graphs, icons, or charts. If you need something customized, you can also create your graphics. Then, use the Title feature to add text that explains key points or highlights important information.
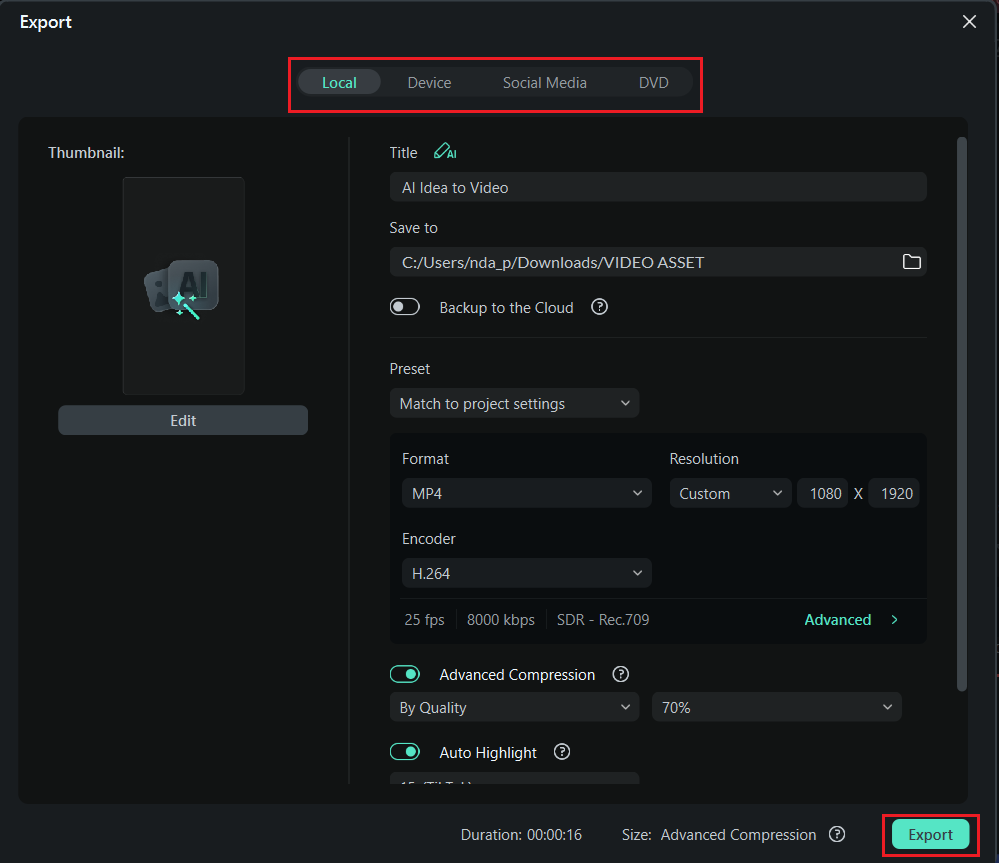
Export and Share
Once you've finished creating your infographic video, you can export it in high quality directly to your device. If you want to share it right away, Filmora also allows you to upload your video directly to social media platforms like YouTube.
Part 3. How to Make an Effective Infographic Video
Looking back at the infographic video examples we covered earlier, you might notice they all have a few things in common. They're clear, engaging, and easy to follow. These videos are carefully crafted with a few smart strategies.

Here are some practical tips to help you do the same and ensure your infographic video delivers your message with impact:
- Speak directly to your audience: Use a tone and language that your audience relates to. From explaining data to breaking down a process, talk to your viewers like you're having a conversation.
- Tell meaningful stories: Even in a short infographic video, a story can make a difference. Frame your information in a way that follows a logical flow such as problem, solution, and impact. People remember stories more than statistics.
- Balance visuals and text: Too much text can feel overwhelming, and too many visuals can be confusing. Find the right mix so that each element supports the other. Let your visuals illustrate your point, and keep the text short and to the point.
- Focus on what matters most: Don't try to say everything at once. Keep the core message and build your video around it. If you're explaining a concept, keep supporting points concise and relevant.
- Keep it simple and clear: A good infographic video is not about flashy animations, it's about clarity. Use a clean design, consistent fonts, and an easy-to-read layout to help your message stand out.
- Use spacing for easy reading: Make space for your visuals and text. White space can make your video feel more open, less cluttered, and easier to understand.
- Be real!: Authenticity is essential. Don't be afraid to let your brand personality or voice come through in the video. Audiences connect more with content that feels genuine.
Conclusion
It's easier and more fun to create a great infographic video than you might think. With the right inspiration, simple tools like Filmora, and a clear message, you can turn any idea into something people want to watch and share. It's not about being perfect, but about being clear, creative, and authentic. Whether explaining a concept, telling a story, or presenting data, a powerful infographic video will help your audience understand and remember it. So, start exploring your ideas and convey your message through an infographic video.
secure download