100% Security Verified | No Subscription Required | No Malware

Are you looking for an infographic video maker to simplify your video creation process? Infographic videos can help you turn complex data into animated visuals. Presenting data, facts, and statistics with visuals makes the content easier to understand and more engaging to watch. An infographic video creator helps you design videos that present information clearly. It's a great tool for anyone who wants to make data more digestible without overwhelming their audience.
In this guide, you'll learn how to create animated visuals using an infographic animation maker powered by AI. You'll also get tips on how to guide AI to achieve better results. Let's get started!

In this article
Part 1. What Is an Infographic Video and What Can You Do with It?
An infographic video maker is a tool that turns complex data into animated and easy-to-understand visuals. Unlike static infographics, which rely solely on text and images, an infographic video blends motion, sound, and visuals to explain data or concepts.
Benefits of Infographic Videos
- Make complex topics easier to understand: Visual animations paired with voiceovers or captions make it easier to follow along. It helps break down technical or detailed information into digestible parts.
- Boost viewer retention and engagement: Animation adds pacing and movement that keeps viewers watching longer and helps them remember more of what they see.
- Increase social media shares and reach: Short and animated content, such as infographic videos, performs well on platforms like Instagram, LinkedIn, and YouTube and is more likely to be shared across platforms.
- Strengthen brand image: Presenting data with animated content makes your message feel professional and polished.
Examples and Use Cases of Infographic Videos
- Product or App Demos: Showcase features and explain how your product works through visuals.
- Timelines: Present a sequence of events or milestones in an animated format.
- Step-by-Step How-To Videos: Break down tutorials into simple visual steps, icons, arrows, and motion graphics.
- Data Visual Reports: Present charts, stats, or reports with animation for better clarity.
Understanding the power of infographic videos is just the beginning. Next, let's walk through how to use an infographic video creator to make your animated visuals with the help of AI.
Part 2. How to Create an Infographic Video with AI
Using an infographic animation maker powered by AI helps you create animated visuals much faster. It can help you automate the script, scenes, and transitions. One of the video editors that can help you create infographic-style content is Wondershare Filmora.
 secure download

Filmora has an AI feature called Animated Charts that can help you transform written prompts into animated videos. Instead of building everything from scratch, you can describe your concept. The AI will generate the script, scenes, subtitles, transitions, and more.
Here's how to create an animated infographic video:
Infographic Video Maker: How to Create Animated Infographics with AI
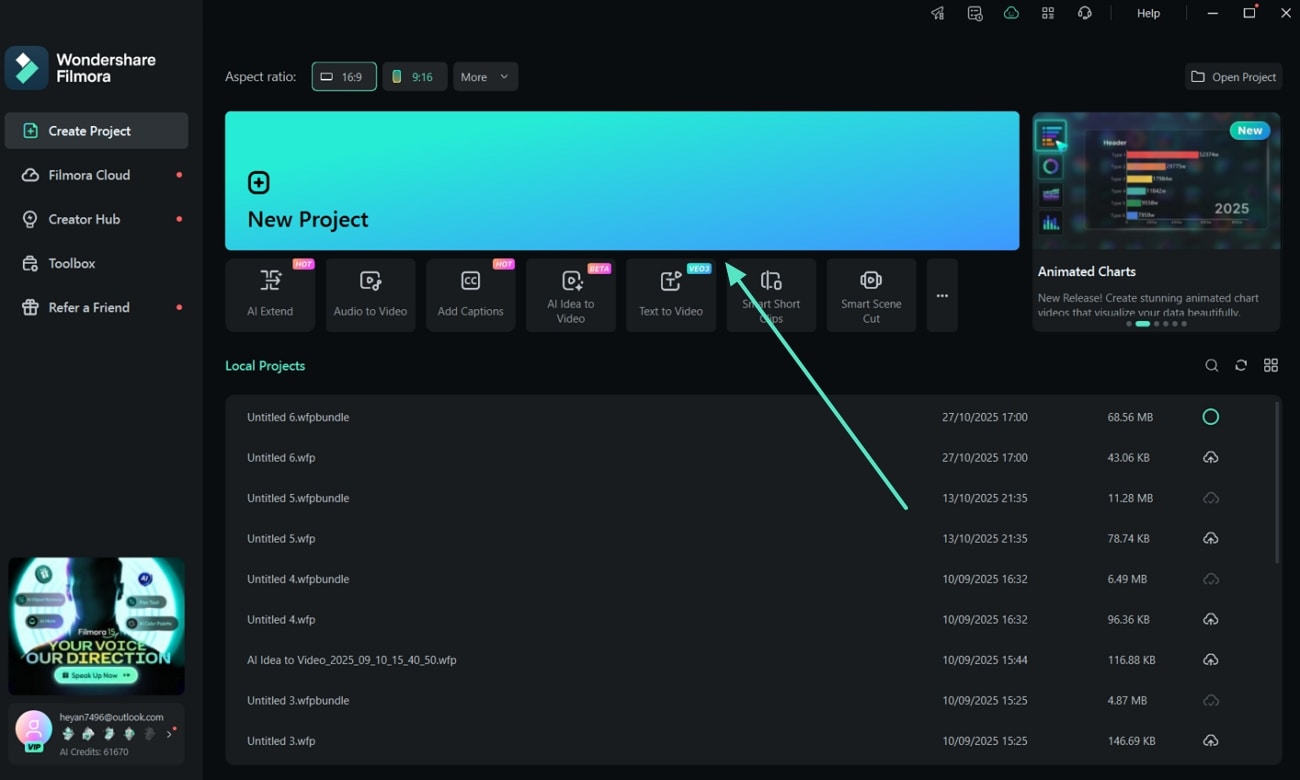
Step 1Launch Filmora and Start a New Project
Open Filmora and click New Project from the startup window to begin creating your AI-powered infographic video.
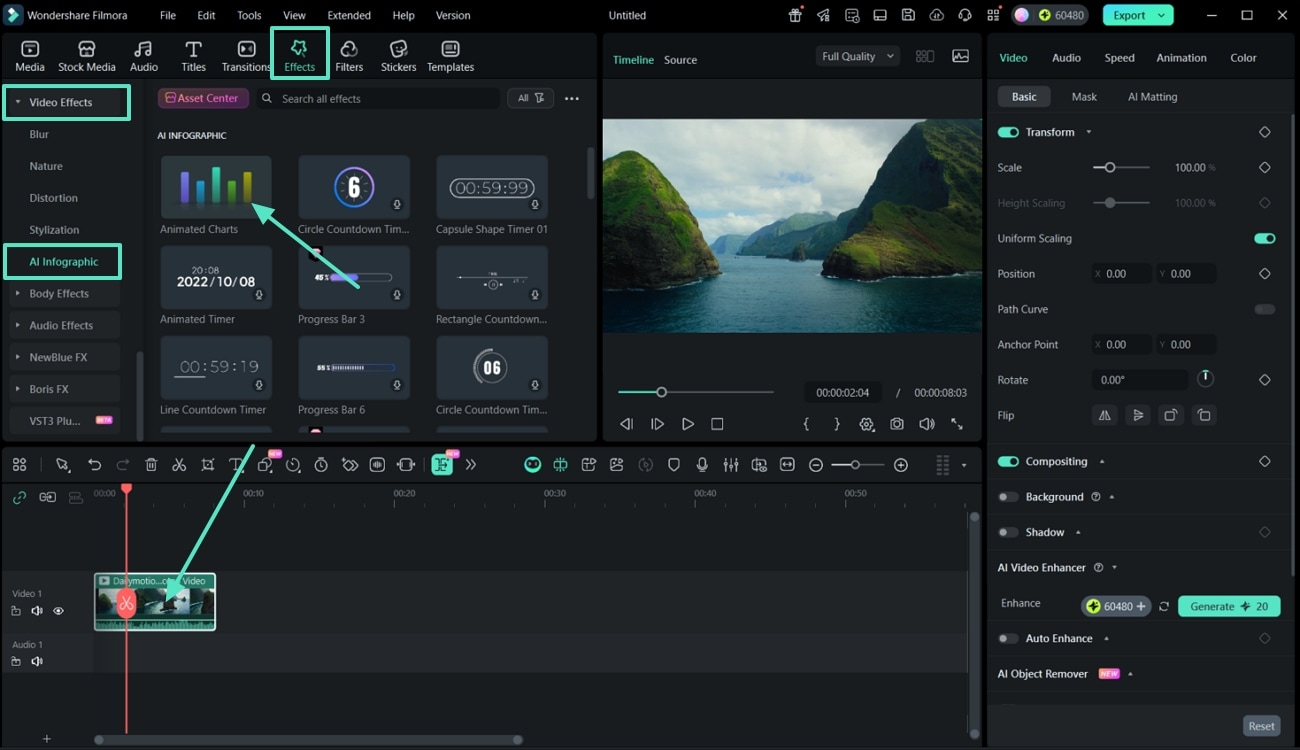
Step 2Access Animated Charts in the AI Infographic Section
Go to the Effects tab on the top toolbar, then select Video Effects > AI Infographic > Animated Charts from the sidebar to access the available templates.
Step 3Choose a Chart Type and Import Data
In the Animated Charts window, select your preferred Chart Type and head to the Data section. Import your data file, then edit categories, values, or time columns as needed.
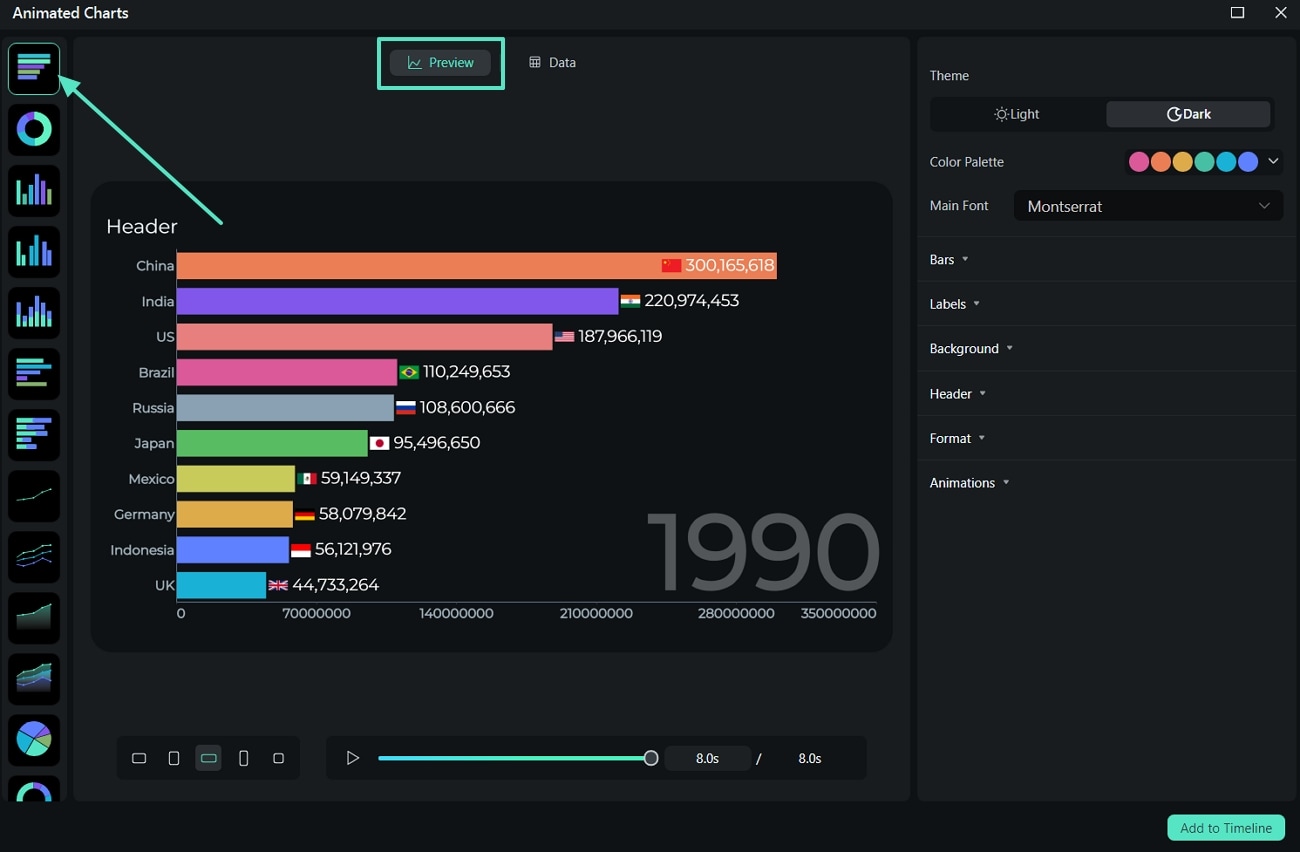
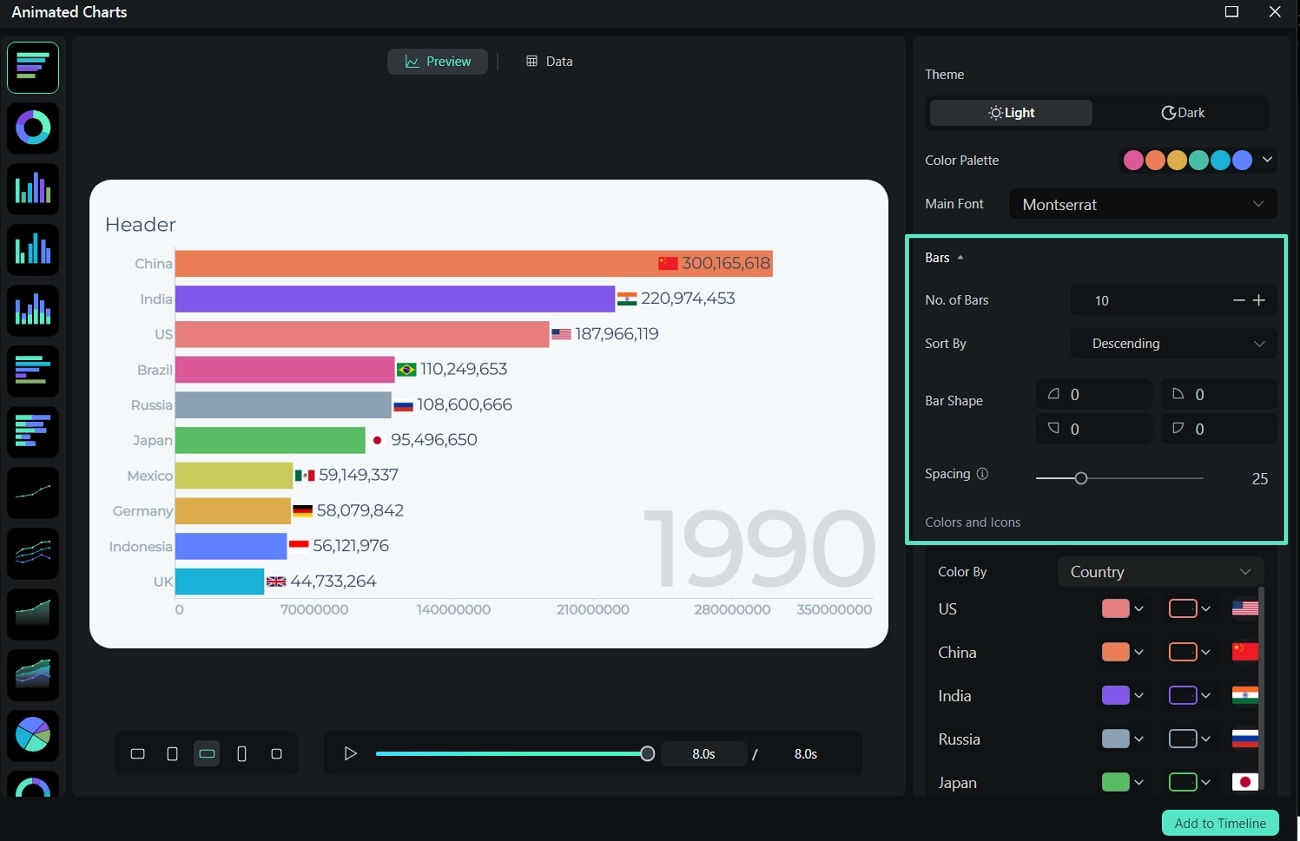
Step 4Customize the Chart Style and Design
Adjust the Aspect Ratio, Theme, Color Palette, and Font to match your video style. You can also modify Bar Shapes, Colors, and Spacing for a clean visual look.
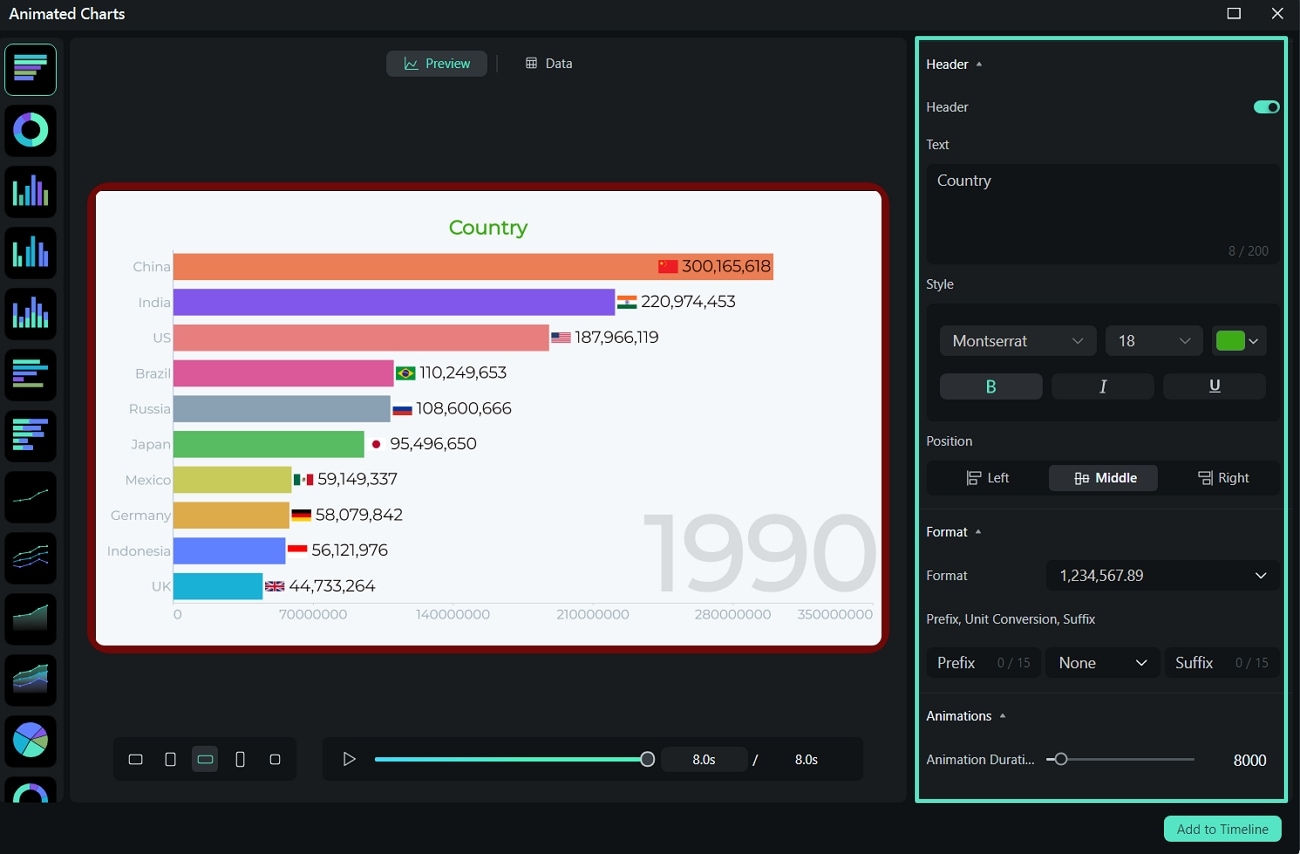
Step 5Edit Labels, Background, and Header
Refine your chart by adjusting Label Positions, editing Axis and Time Labels, and changing the Background or Border settings. You can also enable and edit the Header text for a professional finish.
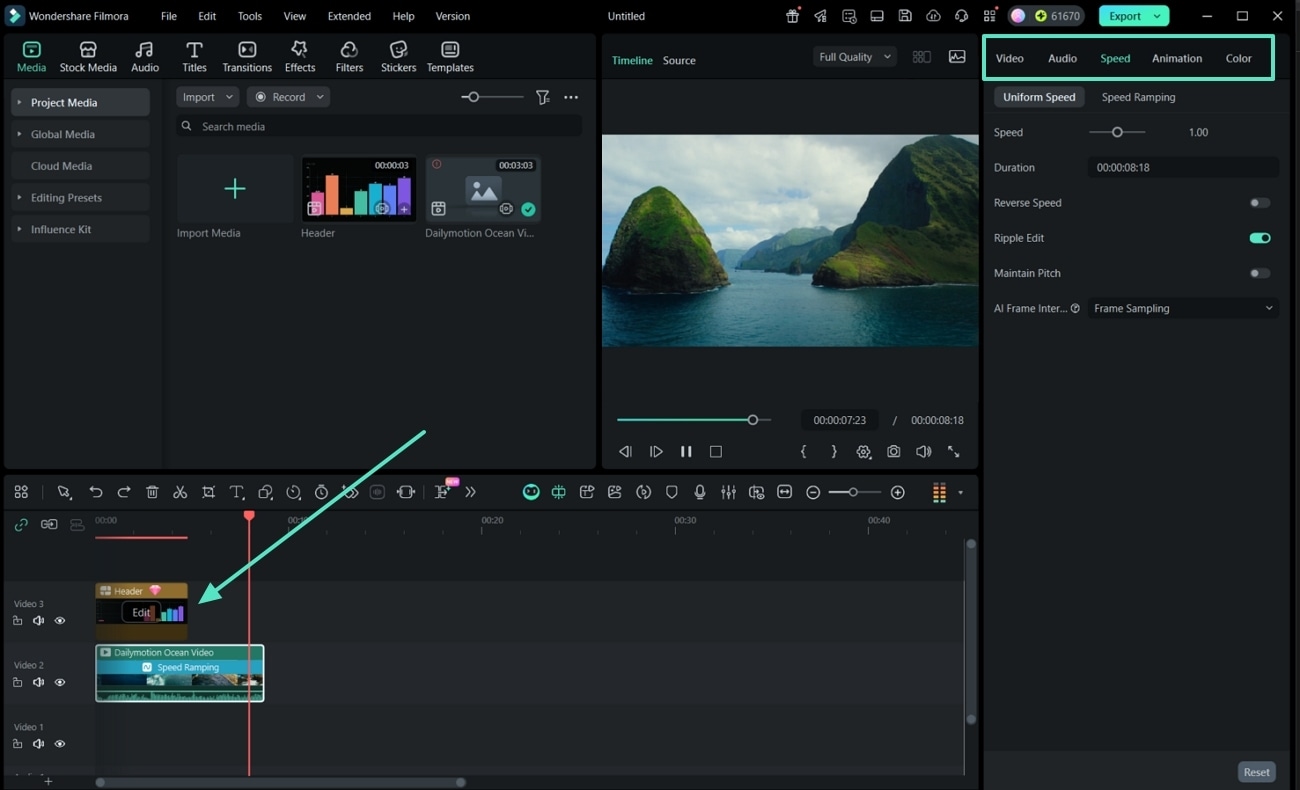
Step 6Add to Timeline, Preview, and Export
Click Add to Timeline to insert your animated chart into the video. Fine-tune visual parameters, preview your project, and finally hit Export to save your AI infographic video.
secure download
Part 3. How to Guide the AI for Better Infographic Videos
Using infographics animation software like Filmora can speed up your creative process. However, your input still matters to make the AI tools perform better. The more focused and specific your prompts are, the better your AI-generated video will look and feel.
Here are a few tips on how to guide the AI effectively:
- Write focused plot descriptions: Break down your message into smaller ideas. One main point per scene makes it easier for the AI to build clear and logical visuals.
- Be specific in your visual descriptions: Instead of writing "introduce the app," write something like "show the app dashboard with animated charts displaying user growth." The more context you give, the more accurate the visuals will be.
- Match the style with your content tone: Use the Comic or Anime style for fun and friendly topics. Go for Realistic if you're working on professional or data-heavy subjects like reports, business updates, or explainer videos.
Common Mistakes to Avoid
- Giving vague or minimal scene instructions: The AI needs direction. Avoid filler prompts like "something happens here." Even a short phrase like "highlight user benefits" gives it something to work with.
- Overloading a single scene with too much information: Keep each scene focused. Packing multiple data points or steps into one visual can become confusing. Spread complex ideas across multiple scenes.
- Leaving out a call to action (CTA): To give your infographic video a purpose, end your video with a clear CTA, like "Follow for more tips" or "Visit our website." You can add this as on-screen text or a voiceover.
Conclusion
Use an infographic video maker to turn data into animated visuals. Check out Wondershare Filmora if you're looking for an infographic video creator that uses AI to handle most of the editing work. Remember to provide clear descriptions and visual references to help AI produce better results.
Use Filmora as an infographic animation maker today and make your data more engaging!
secure download