For the Best Results, Use the Latest Version.
Filmora User Guide for Mac
-
Preparations for Mac
-
Account (Mac)
-
Get Started & Basic Settings (Mac)
- Release notes for Mac
- Latest Versions and Features for Mac
- Get Started on Mac - Full Guide
- Download/register/uninstall on Mac
- Panel Layout on Mac
- Keyboard shortcuts on Mac
- Touchbar on Mac
- Change playback quality on Mac
- Render preview files on Mac
- Manage Timeline on Mac
- Media for use on Mac
- Logo Reveal For Mac
- Marked Favorites for Mac
-
Compatibility & Tech Specs (Mac)
-
Performance Settings (Mac)
-
-
Creating Projects - Mac
-
Creating New Projects (Mac)
-
-
Importing & Recording - Mac
-
Importing (Mac)
-
Recording (Mac)
-
-
Video Editing for Mac
-
Basic Video Editing for Mac
- Edit Live Photos on Mac
- Enable/Disable Clip for Mac
- Magnetic Timeline For Mac
- Dual Monitor Setup for Video Editing on Mac
- Select All Clips on Timeline for Mac
- Auto Ripple for Mac
- Split & Cut Videos on Mac
- Compositing on Mac
- Crop and zoom on Mac
- Playback Zoom Level for Mac
- Change Speed on Mac
- Play Video in Reverse on Filmora for Mac
- Mark In and Mark Out for Mac
- Markers for Mac
- Group Clips in Filmora for Mac
- Customized Backgrounds for Videos and Images in Mac
- Video snapshot on Mac
- Freeze Frame on Mac
- Auto enhance on Mac
- Applying Drop Shadow for Mac
- Adjustment Layer for Mac
- Mark Clips in Filmora for Mac
- Video Editing Ruler – Mac
- Apply Transforming for Mac
-
Advanced Video Editing for Mac
- Text Animation Path for Mac
- Create Multi-Camera Clip for Mac
- Filmora Motion Blur | Mac
- Drawing Tools for Mac | Filmora Guide
- Compound Clips for Mac
- AI Video Enhancer for Mac
- Video Chapters in Filmora for Mac
- Filmora Flicker Removal Guide | Mac
- Multi-Clip Editing for Mac
- Keyframe Graph Editor for Mac
- Add Animation Keyframing in Filmora for Mac
- Mask on Mac
- PIP (Picture in Picture) in Filmora on Mac
-
AI-Powered Video Editing for Mac
- Smart Scene Cut for Mac
- Smart Short Clips for Mac
- Filmora AI Eye Contact - Mac
- Filmora Image to Video for Mac
- AI Idea to Video for Mac
- AI Text-to-Video for Mac
- Instant Cutter Tool on Mac
- AI Face Mosaic for Mac
- Filmora Image to Prompt for Mac
- Keyframe Path Curve for Mac
- Filmora AI Image Enhancer Guide – macOS
- Planar Tracking for Mac
- Filmora AI Relight - Mac
- AI Extend For Mac
- AI Script-to-Video for Mac
- AI Text-Based Editing in Mac
- Create With Instant Mode on Mac
- ChatGPT Plugin - AI Copywriting on Mac
- AI Smart Cutout in Filmora for Mac
- Auto reframe on Mac
- Lens Correction in Filmora for Mac
- AI Portrait Cutout on Mac
- Scene detection on Mac
- AI Smart Masking for Mac
- AI Mate Editing for Mac
- Motion Tracking on Mac
- Video Stabilization for Mac
- AI Video/Photo Object Remover for Mac
- AI Smart Search for Mac
- AI Skin Tone Protection for Mac
- Green screen on Mac
- Super Slow Motion with Optical Flow for Mac
- AI Stylizer for Mac
- Video Denoise for Mac
-
-
Audio Editing for Mac
-
Basic Audio Editing for Mac
-
Advanced Audio Editing for Mac
-
AI-Powered Audio Editing for Mac
- Audio To Video for Mac
- AI Sound Effect for Mac
- Smart BGM Generation on Mac
- AI Voice Enhancer for Mac
- Audio Stretch for Mac
- AI Audio Denoise for Mac
- Auto Synchronization on Mac
- AI Vocal Remover for Mac
- AI Auto Beat Sync for Mac
- AI Music Generator for Mac
- AI Voice Cloning on Mac
- Silence Detection on Mac
-
-
Text Editing for Mac
-
Basic Text Editing for Mac
-
Advanced Text Editing for Mac
-
AI-Powered Text Editing for Mac
-
-
Video Customizations for Mac
-
Video Effects (Mac)
-
Audio Effects (Mac)
-
Transitions (Mac)
-
Stickers (Mac)
-
Filters (Mac)
-
Color Editing (Mac)
-
Animations (Mac)
-
Templates (Mac)
-
Asset Center (Mac)
-
-
Exporting & Share & Cloud Backup - Mac
Filmora Tutorial Videos
Filmora 13 & 14 User Guide in PDF
Filmora 12 User Guide in PDF
Filmora 11 User Guide in PDF
Filmora 9 & 10 User Guide
Animated Charts for Mac
Filmora introduced the Animated Charts feature that enhances data presentation with dynamic visual effects. This tool lets you import data files and create professional AI-powered animated charts effortlessly. Using smart animation presets, you can apply effects like growth, entrance, or sorting without complex editing. The tool provides fixed-style templates that offer extensive customization options, catering to users who seek both personalization and professionalism.
Ready to turn your data into dynamic charts? Follow the steps below to learn how to create and add an animated chart to your videos with Filmora:
Note:
The configuration panels may vary slightly depending on the specific chart type you select. This guide demonstrates the process using a particular chart; however, the general settings and operational logic remain largely consistent across most chart types.Index
Step 1. Create New Project on Filmora
To begin the process, launch Filmora on your Mac and press the New Project tab from its homepage.
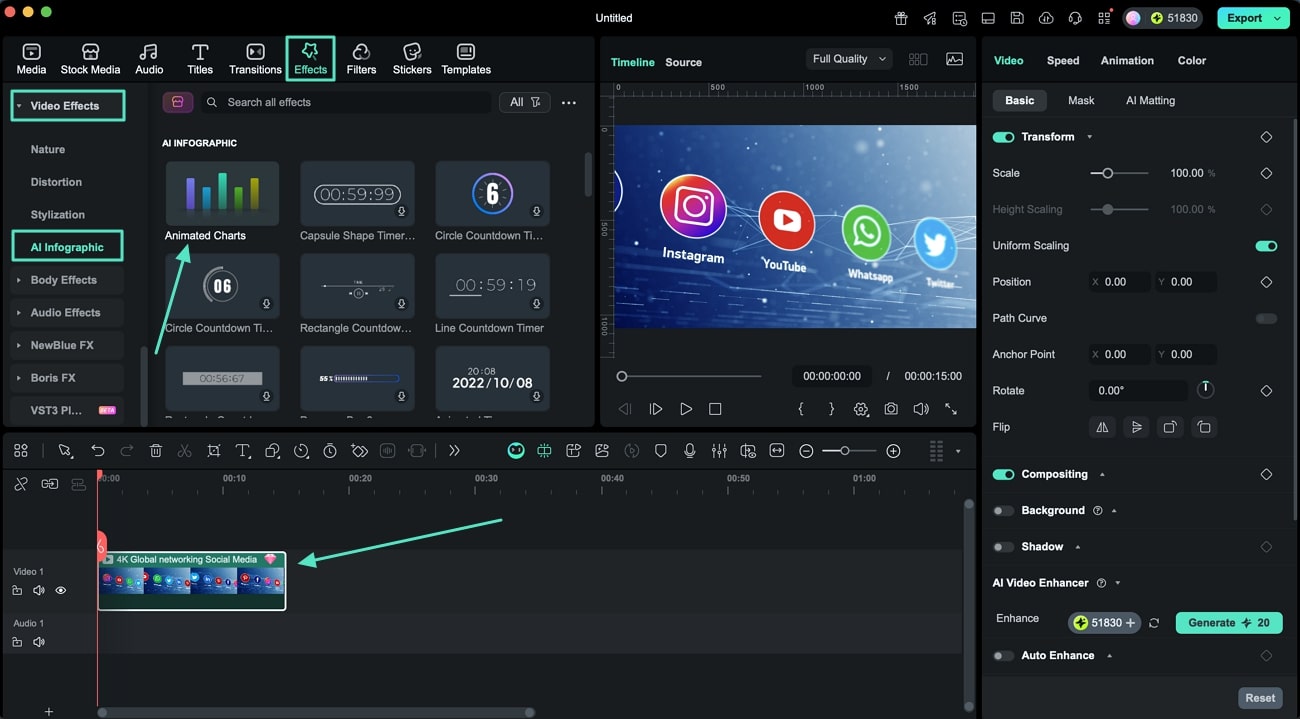
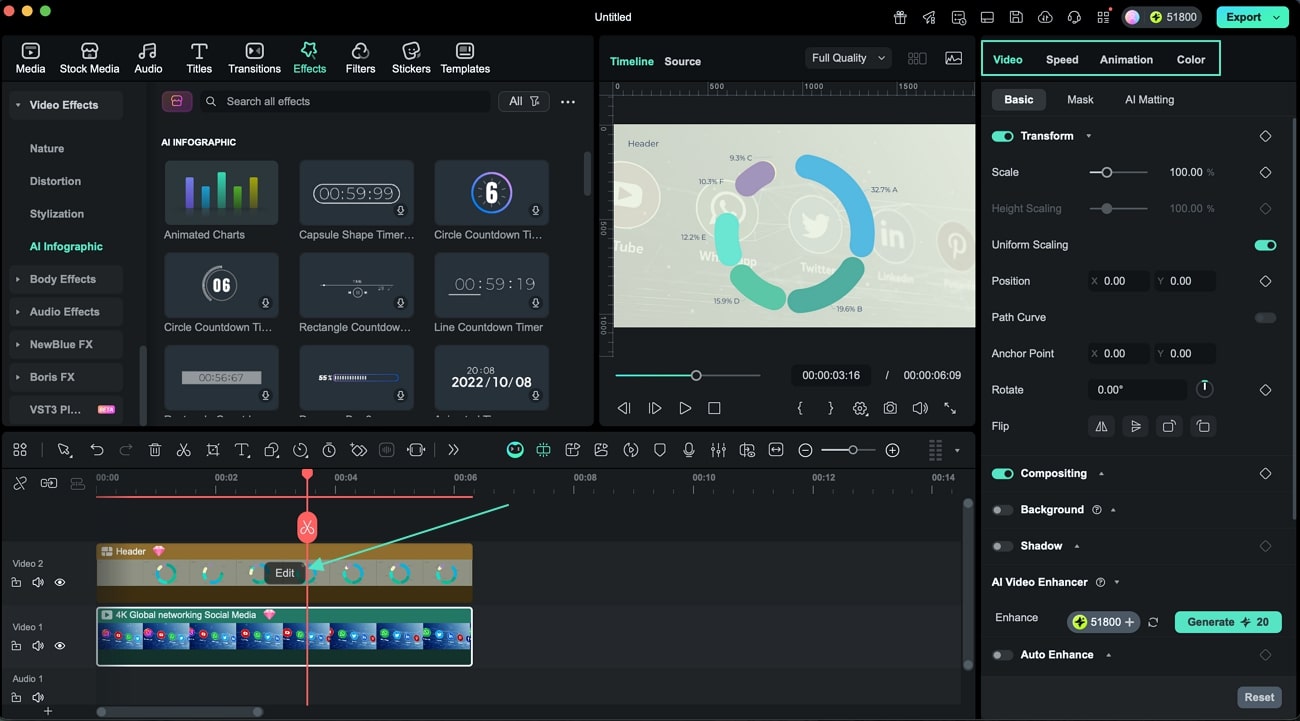
Step 2. Access Animated Charts
With the video imported to the timeline, head to the menu bar at the top and access the Effects option to enable the library. Lead into the Video Effects section on the left and further expand the AI Infographic section. Moving forward, locate the Animated Charts option to choose your desired graphics.
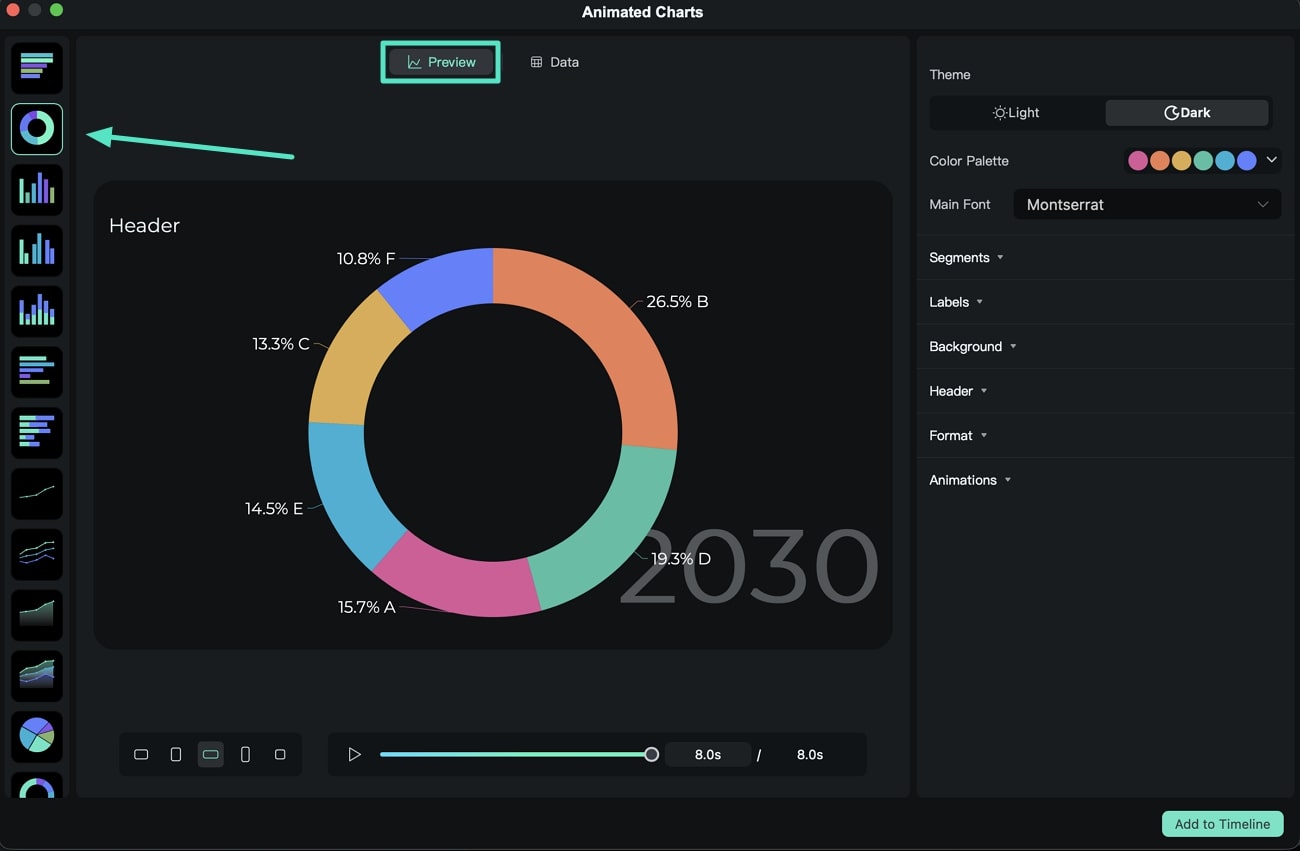
Step 3. Select The Chart Type
Within the Preview section, select the Chart Type (such as bar, line, bar chart race, pie, donut chart, and more) from the left panel and look into it within the preview window.
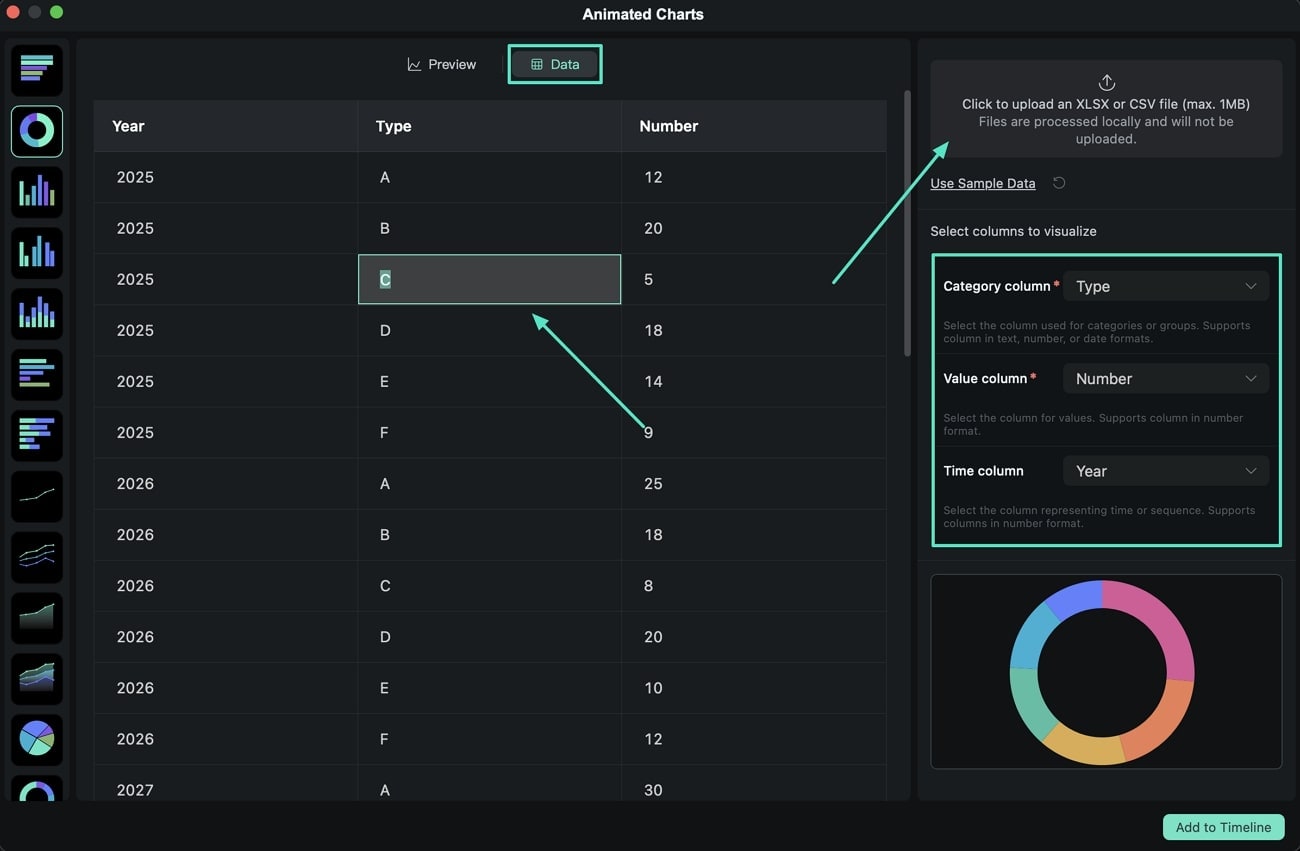
Step 4. Upload the Data File and Modify
Next, go to the Data tab and upload the desired data file. Configure the data settings such as the Category Column, Value Column, or Time Column. You can also double-click the data entries to change names or values according to your requirements.
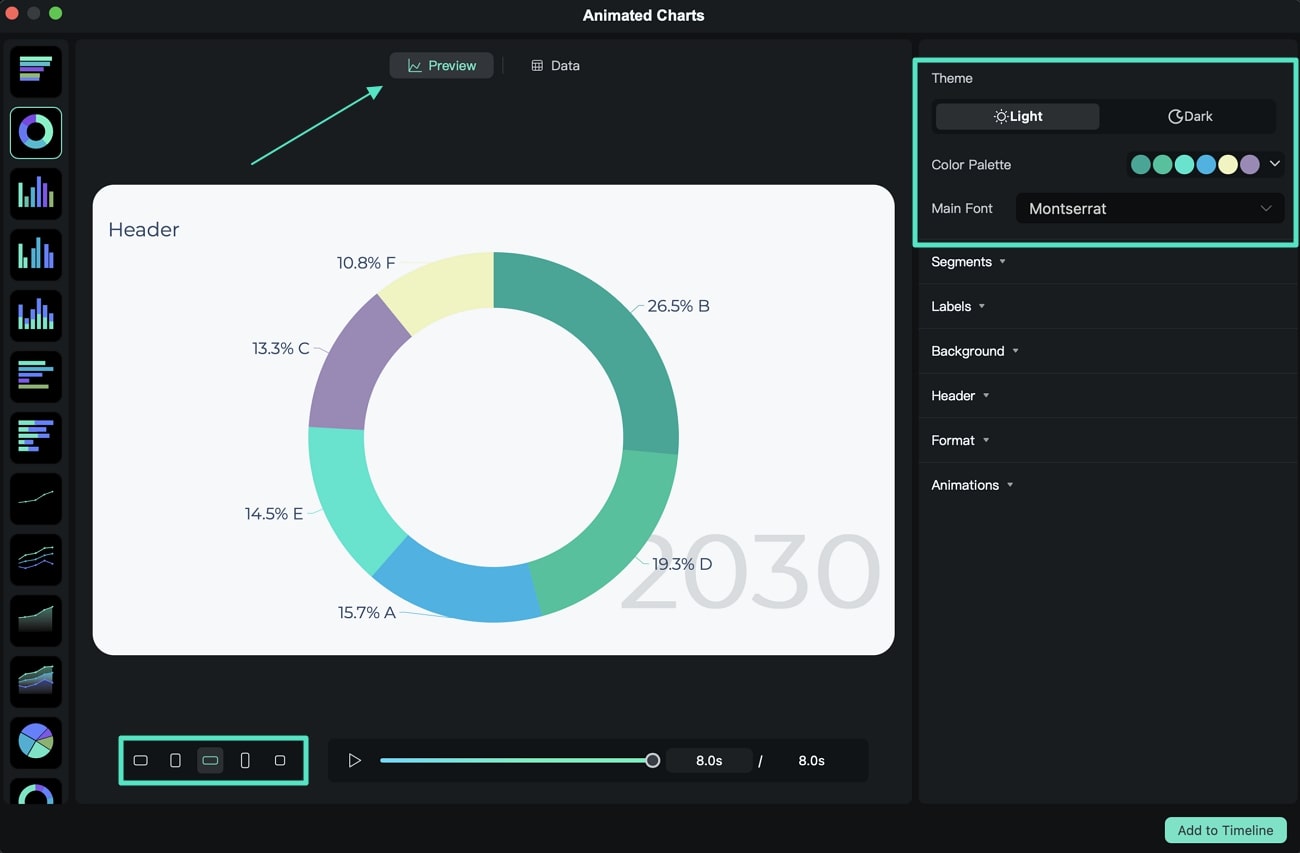
Step 5. Modify the Animated Chart Preview Settings
Navigate to the Preview section again and set the desired Aspect Ratio for your graph at the bottom of the window. On the right side, you can customize the Theme, Color Palette, and Font of the animated chart.
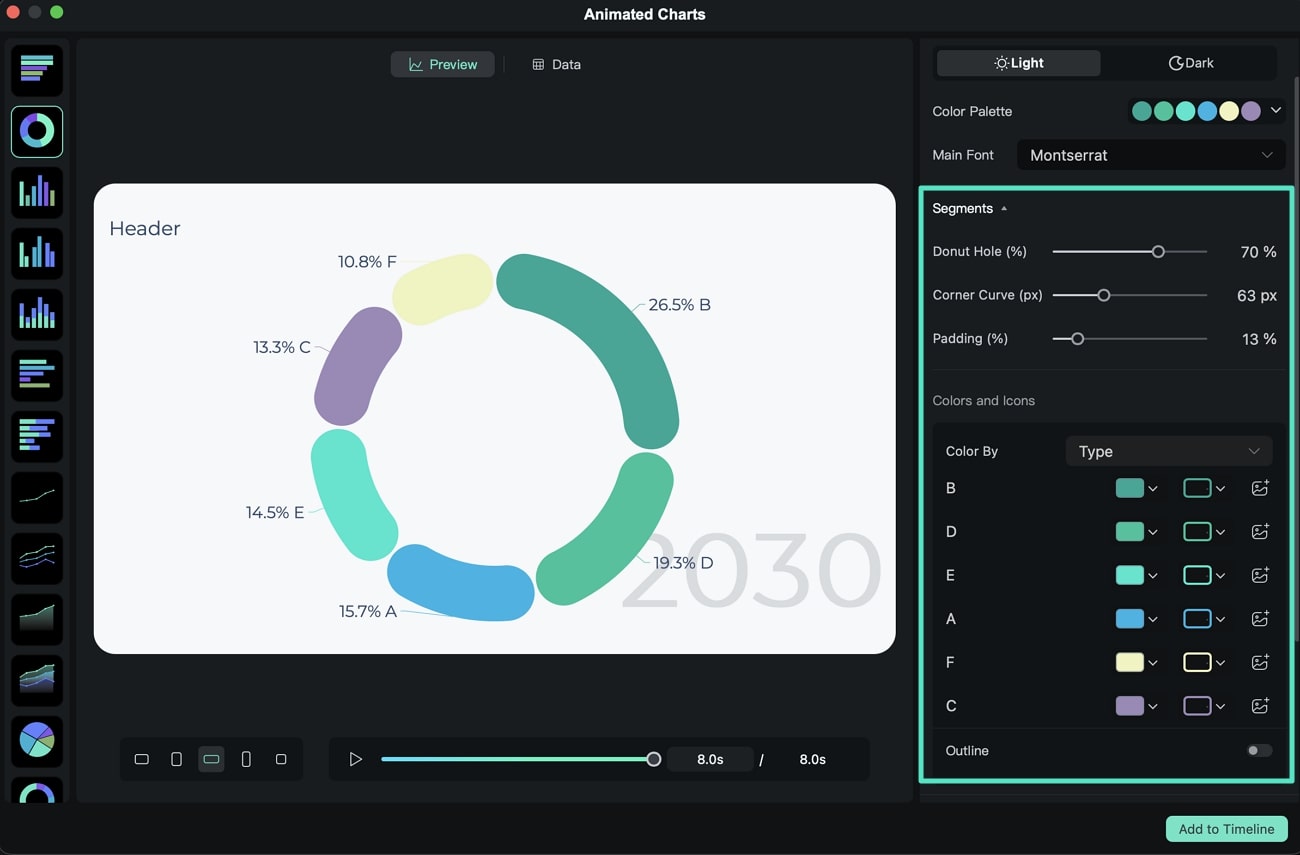
Step 6. Customize Segmentation of Donut Chart
Scroll down to modify the Segments settings within the Donut Chart, which includes the Donut Hole (%), Corner Curve, and Padding. Furthermore, define the color of each component separately in the provided section and enable Outline for prominence.
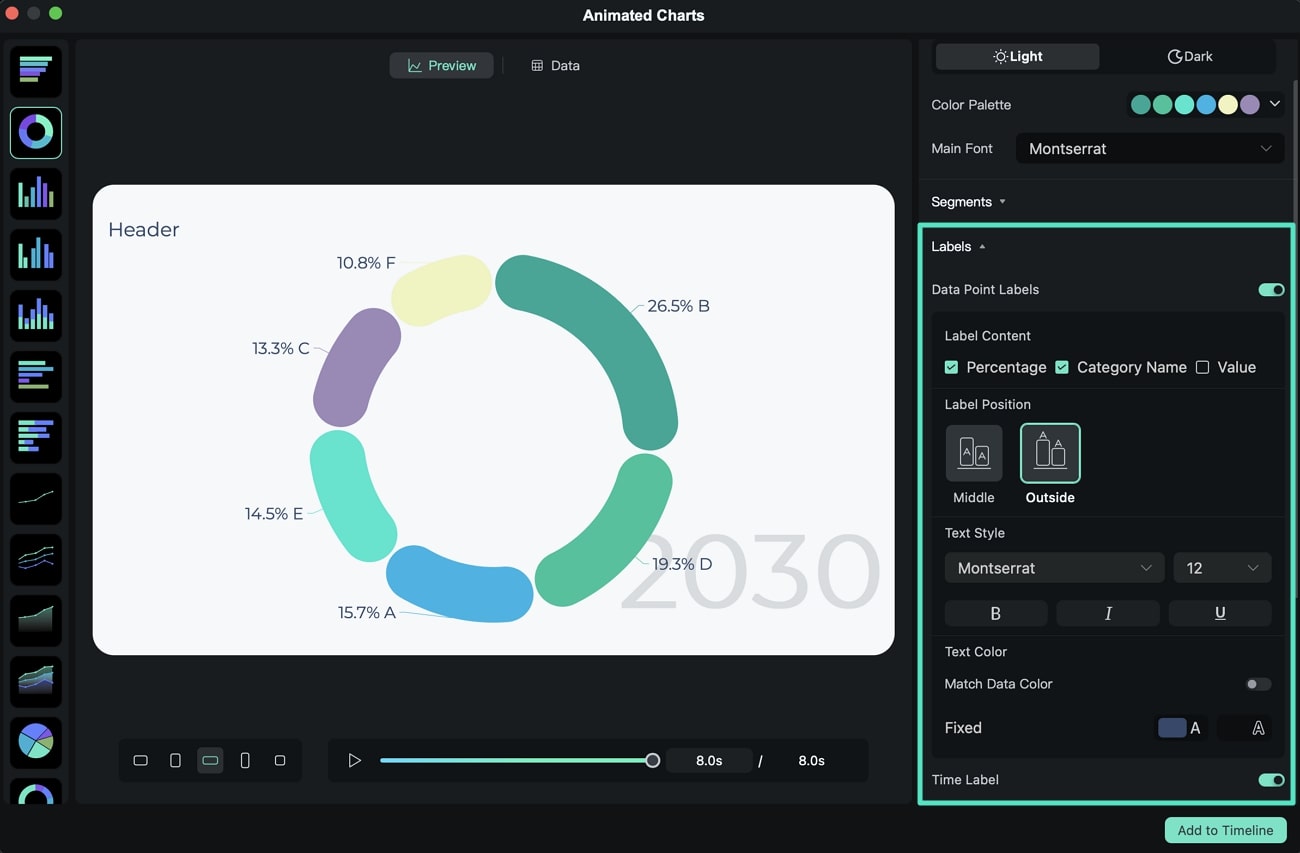
Step 7. Select Labels to Display
Now head to the Labels section and choose the optimal Label Position for the graph label. You can also tweak the Text Style and Time Label properties along with Match Data Color toggle.
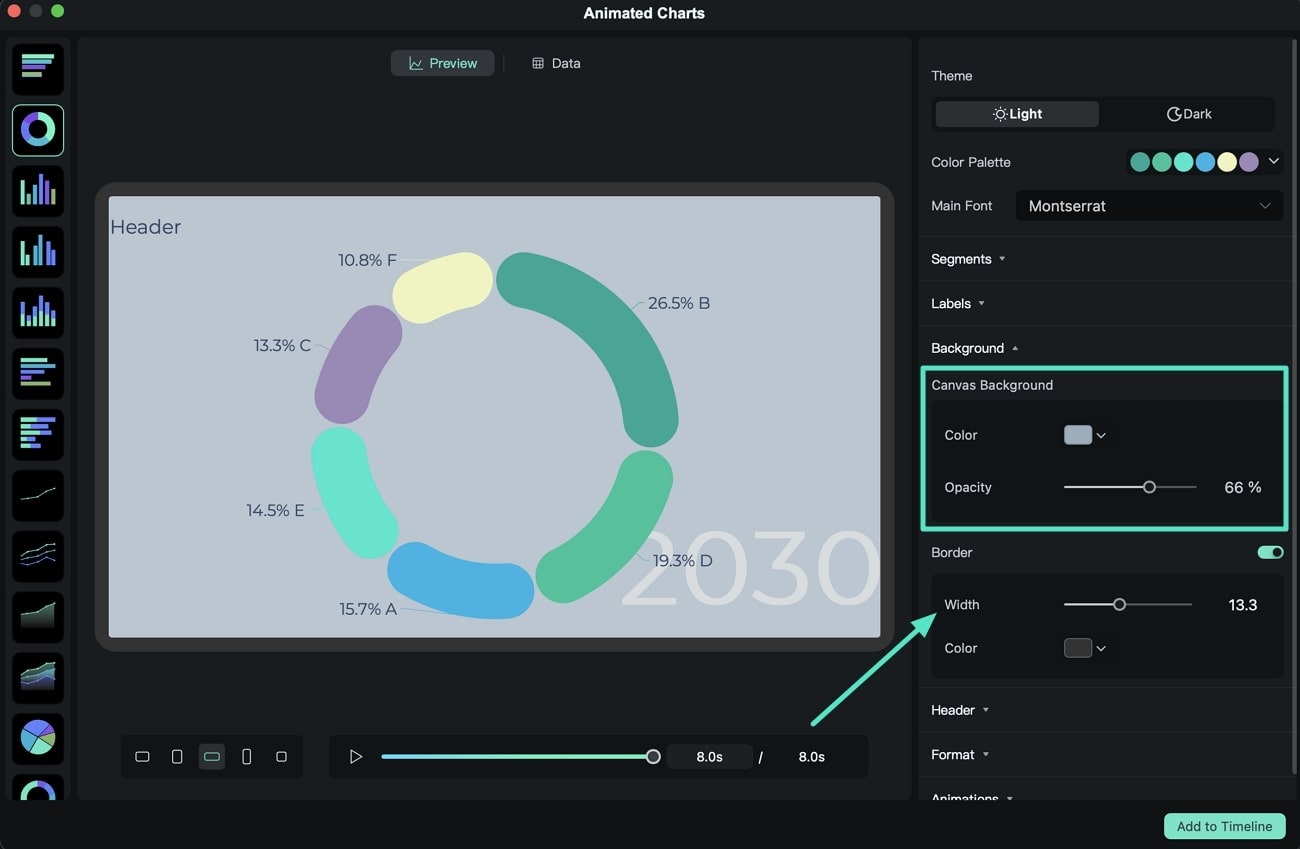
Step 8. Match Background and Border to Video
In the Background section, expand the menu to change the Canvas Background colors according to your preferences. Turn on the Border toggle to adjust its Width and Color as needed.
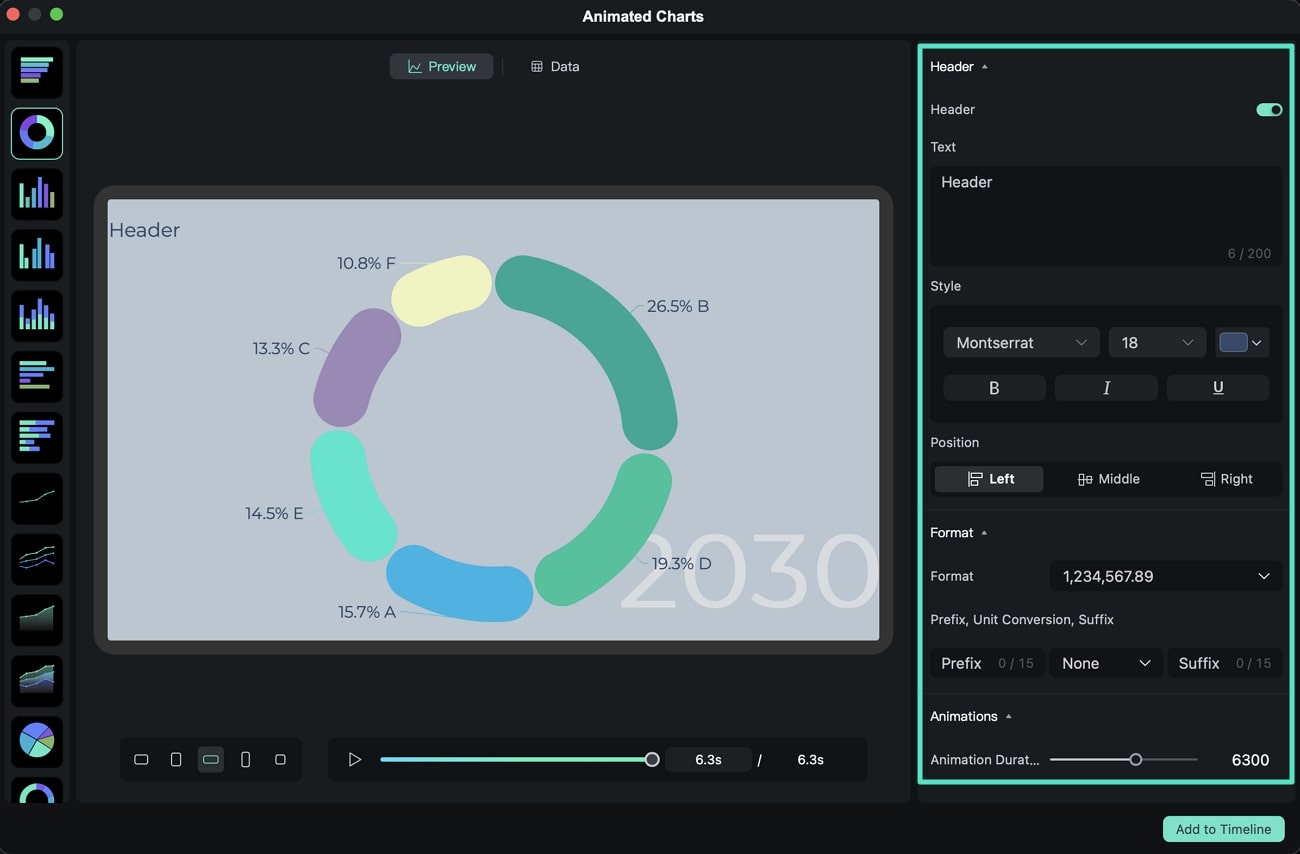
Step 9. Edit Header and Set Animation Length
Move to the Header section and toggle it on to enable the connected settings. Make changes by editing the header Text, changing the Position, and modifying the Style. Head to the Format section and make changes to the Prefix and Suffix to finally adjust the Animation Duration under the Animation section.
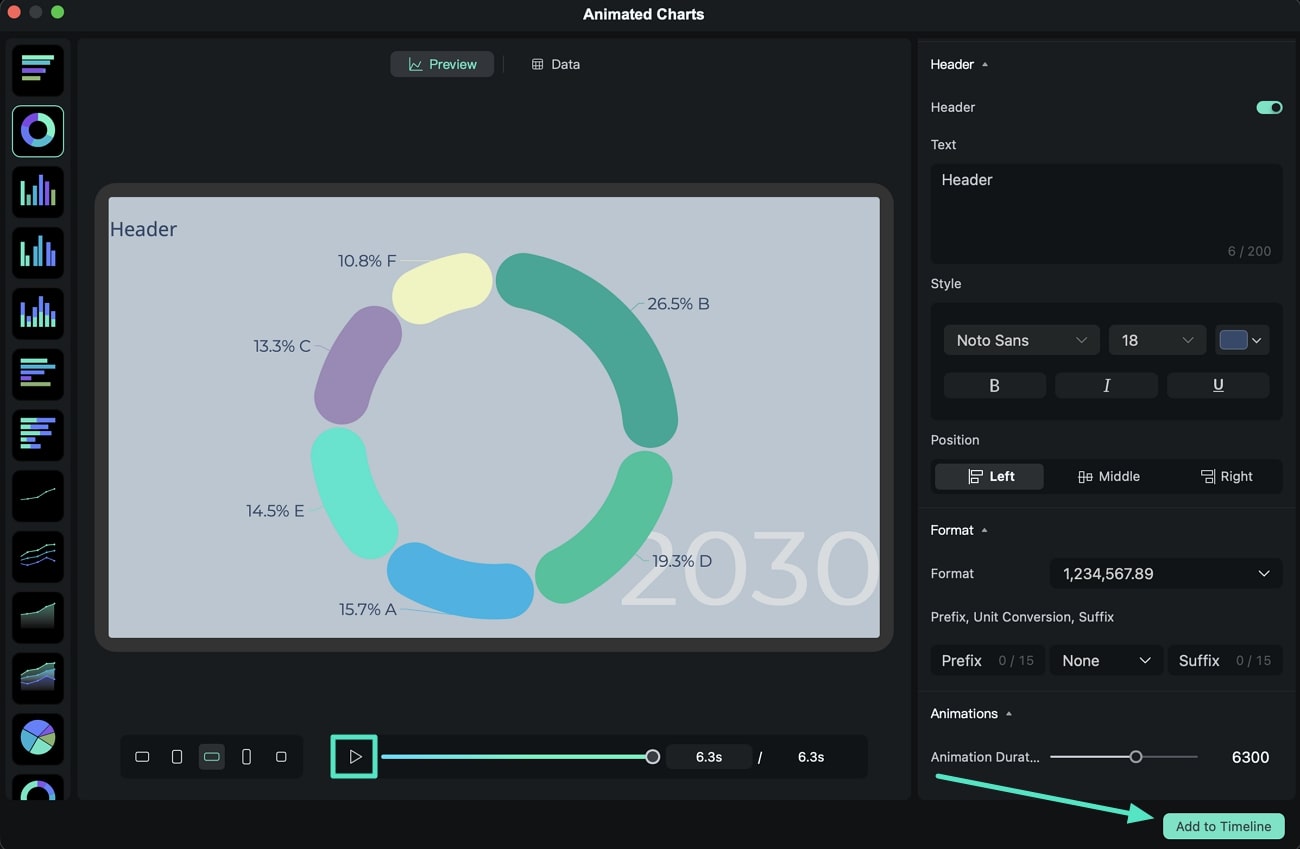
Step 10. Add Animated Charts to Timeline
Use the Play button to preview the animated chart, then press Add to Timeline to insert it for further editing.
Related Posts
Featured Articles
Learn more popular articles from Wondershare.
How to Add a Transition Effect in Premiere Pro + A More Intuitive Alternative
If you are just starting your video editing journey, you are certainly learning about transition effects in Premiere Pro and how to use them.
FonePaw Screen Recorder | Features, Price and How to Use
This FonePaw screen recorder review will tell you everything about this tool from its features, pricing, performance, how to use it plus its best alternative.
5 Ways | How to Record A Zoom Meeting?
Are you looking for the best way to record meetings on Zoom? Here is a comprehensive guide on the best tips and tools to record in Zoom.
Recommended User Guide
Learn how to use more features.
Different Types of Video Effects for Mac
Overview about types of video effects.
Filmstock Assets for Mac
Overview of Filmstock Assets.
Filmora OpenFX Plugins for Mac
Learn how to install and use Filmora OpenFX plugins on Mac to add professional visual effects to your videos easily.