For the Best Results, Use the Latest Version.
-
Preparations
-
Account
-
Get Started & Basic Settings
-
Compatibility & Tech Specs
-
Performance Settings
-
-
Creating Projects
-
Creating New Projects
-
-
Importing & Recording
-
Video Editing for Windows
-
Basic Video Editing
- Enable/Disable Clip in Windows
- Magnetic Timeline for Windows
- Dual Monitor Setup for Video Editing on Windows
- Select All Clips on Timeline for Windows
- Manage Timeline and Tracks on Windows
- Auto Ripple for Windows
- Split & trim video
- Crop & Pan & Zoom Video in Filmora for Windows
- Compositing
- Change Video Speed on Windows
- Playing videos in reverse
- Mark In and Mark Out for Windows
- Markers for Windows
- Group editing
- Customizable Backgrounds for Videos and Images in Windows
- Video snapshot
- Using Freeze Frame in Filmora for Windows
- Logo Reveal For Windows
- Auto Enhance in Filmora for Windows
- Applying drop shadow
- Adjustment layer for Windows
- Apply Transforming for Windows
- Video Editing Ruler – Windows
-
Advanced Video Editing
- Drawing Tools for Windows | Filmora Guide
- Create Multi-Camera Clip in Filmora for Windows
- Compound Clip for Windows
- Multi-Clip Editing for Windows
- Filmora Motion Blur | Windows
- Video Chapters in Filmora on Windows
- Filmora Flicker Removal Guide | Windows
- Apply mask to video
- Creating a PIP Effect for Windows
- Keyframe Graph Editor for Windows
- Add animation keyframing for Windows
- Keyframe Path Curve for Windows
-
AI-Powered Video Editing
- Smart Scene Cut for Windows
- Smart Short Clips for Windows
- AI Face Mosaic for Windows
- Filmora AI Eye Contact- Windows
- AI Video Enhancer for Windows
- AI Text-to-Video for Windows
- Planar Tracking for Windows
- AI Idea to Video for Windows
- Filmora Image to Video for Windows
- Filmora Image to Prompt for Windows
- Instant Cutter Tool for Windows
- AI Extend
- Filmora AI Relight - Windows
- Filmora AI Image Enhancer Guide - Windows
- AI Script to Video Guide for Windows
- AI Text-Based Editing for Windows
- AI Mate Editing for Windows
- Instant Mode in Filmora
- ChatGPT Plugin - AI Copywriting
- AI Smart Cutout for Windows
- Lens correction on Windows
- Auto Reframe Video for Windows
- AI Portrait Cutout
- Scene detection feature
- AI Smart Masking for Windows
- Motion Tracking on Windows
- Video Stabilization for Windows
- AI Video/Photo Object Remover for Windows
- AI Smart Search for Windows
- AI Skin Tone Protection for Windows
- AI Image for Windows
- Chroma key (green screen)
- Super Slow Motion with Optical Flow for Windows
- Video Denoise for Windows
-
-
Audio Editing for Windows
-
Basic Audio Editing
-
Advanced Audio Editing
-
AI-Powered Audio Editing
- Auto synchronization
- AI Sound Effects in Filmora for Windows
- Smart BGM Generation on Windows
- AI Voice Enhancer in Filmora
- AI Voice Cloning in Wondershare Filmora
- AI Music Generator for Windows
- Audio To Video
- AI Vocal Remover for Windows
- AI Auto Beat Sync for Windows
- AI Audio Stretch for Windows
- AI Audio Denoise for Windows
- Silence Detection on Windows
-
-
Text Editing for Windows
-
Basic Text Editing
-
Advanced Text Editing
-
AI-Powered Text Editing
-
-
Video Customizations
-
Video Effects
-
Audio Effects
-
Transitions
-
Stickers
-
Filters
-
Color Editing
-
Animations
-
Templates
-
Asset Center
-
-
Exporting & Share & Cloud Backup
Animated Charts
In this feature overview, we will discuss the new Animated Charts feature of Filmora V15. This feature allows you to make information more interesting by not only importing data files, but also by making professional AI animated charts. You can use the smart animation presets to generate dynamic effects such as growth, entrance, or sorting effects without any complicated edits.
Filmora offers fixed-style templates with greater customization capabilities to meet your demands for personalization and professionalism. Dive into the steps below to get a better understanding of how to create and add an animated chart to videos:
Note:
Settings panels can differ across various chart types, but the underlying configuration logic is similar. While this tutorial illustrates the steps with a single example, always confirm the specific settings based on your chosen chart type.
Index
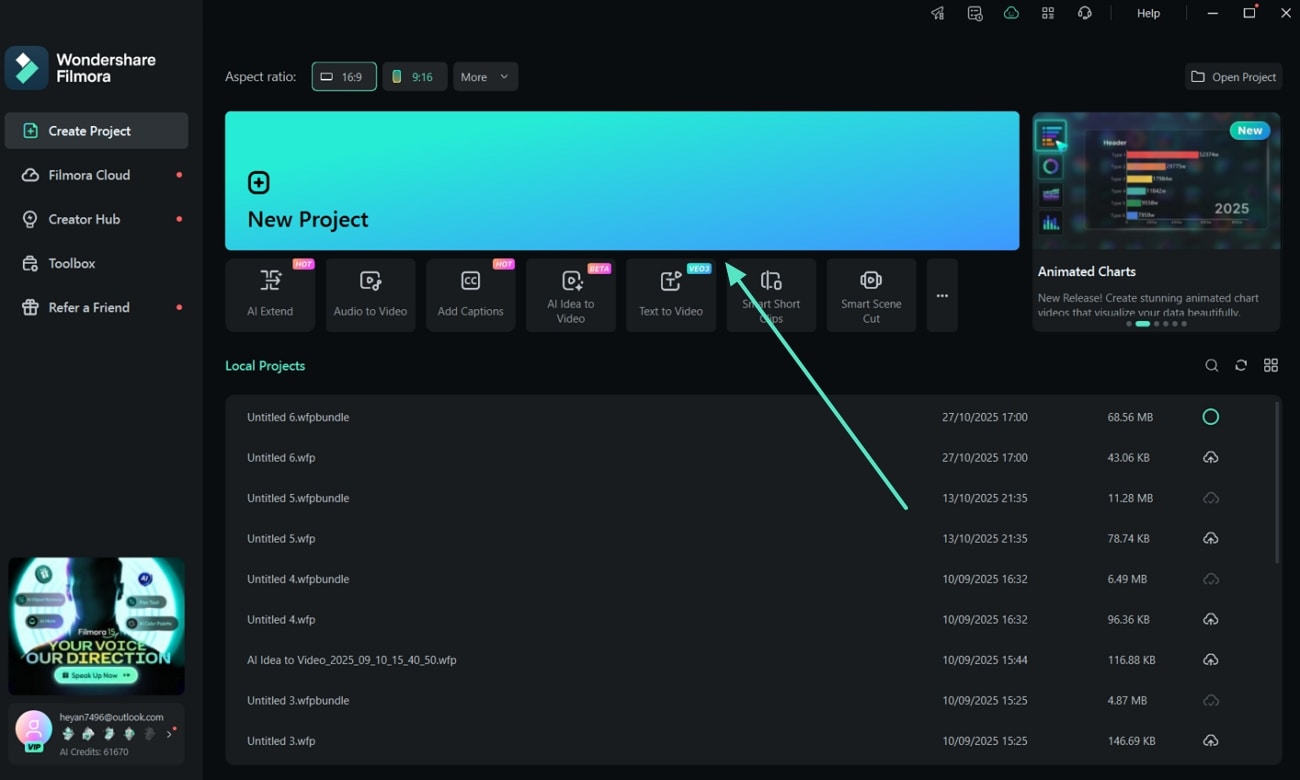
Step 1. Launch Filmora and Choose New Project
Start the process by launching the latest version of Filmora. Click on the New Project button at the Startup Window to start generating animated charts.
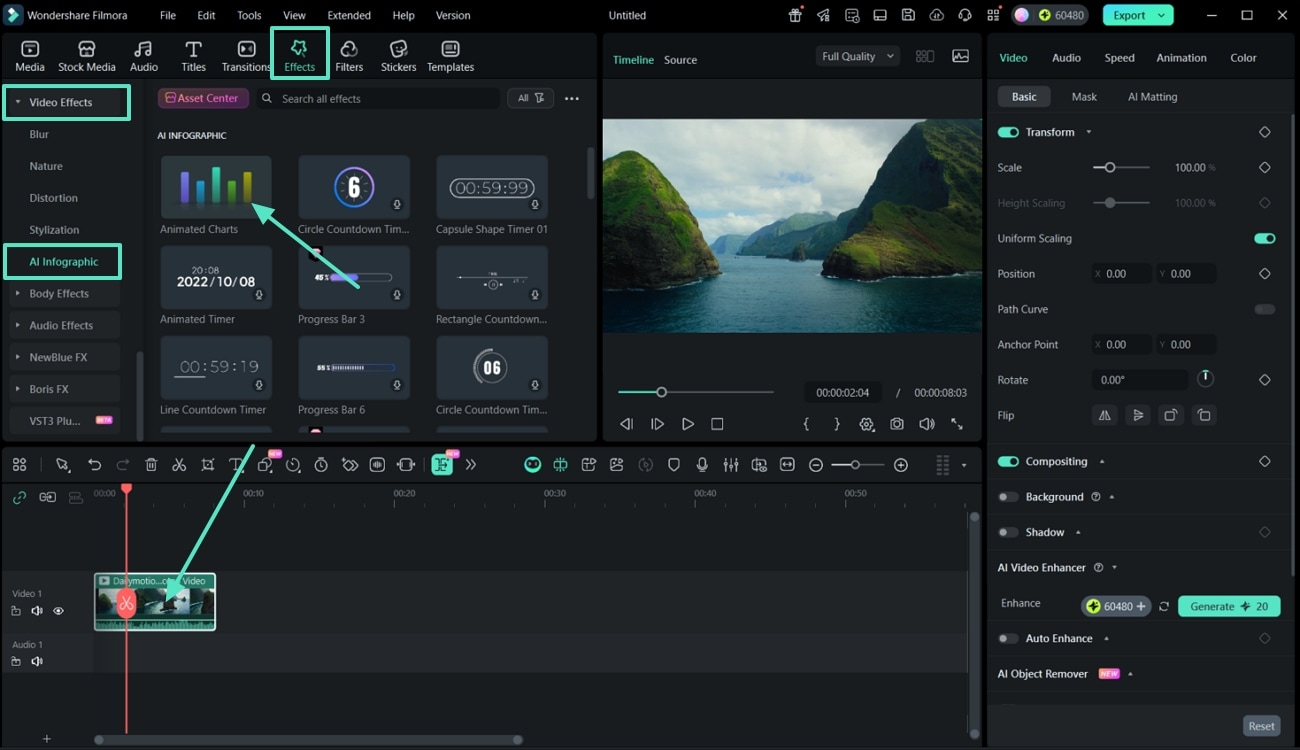
Step 2. Navigate to the Animated Charts
Once you are in the editing interface, import the videos into the timeline, then jump to the Effects section from the top toolbar. From the left sidebar, pick the Video Effects section to scroll its list and choose the AI Infographic > Animated Charts option.
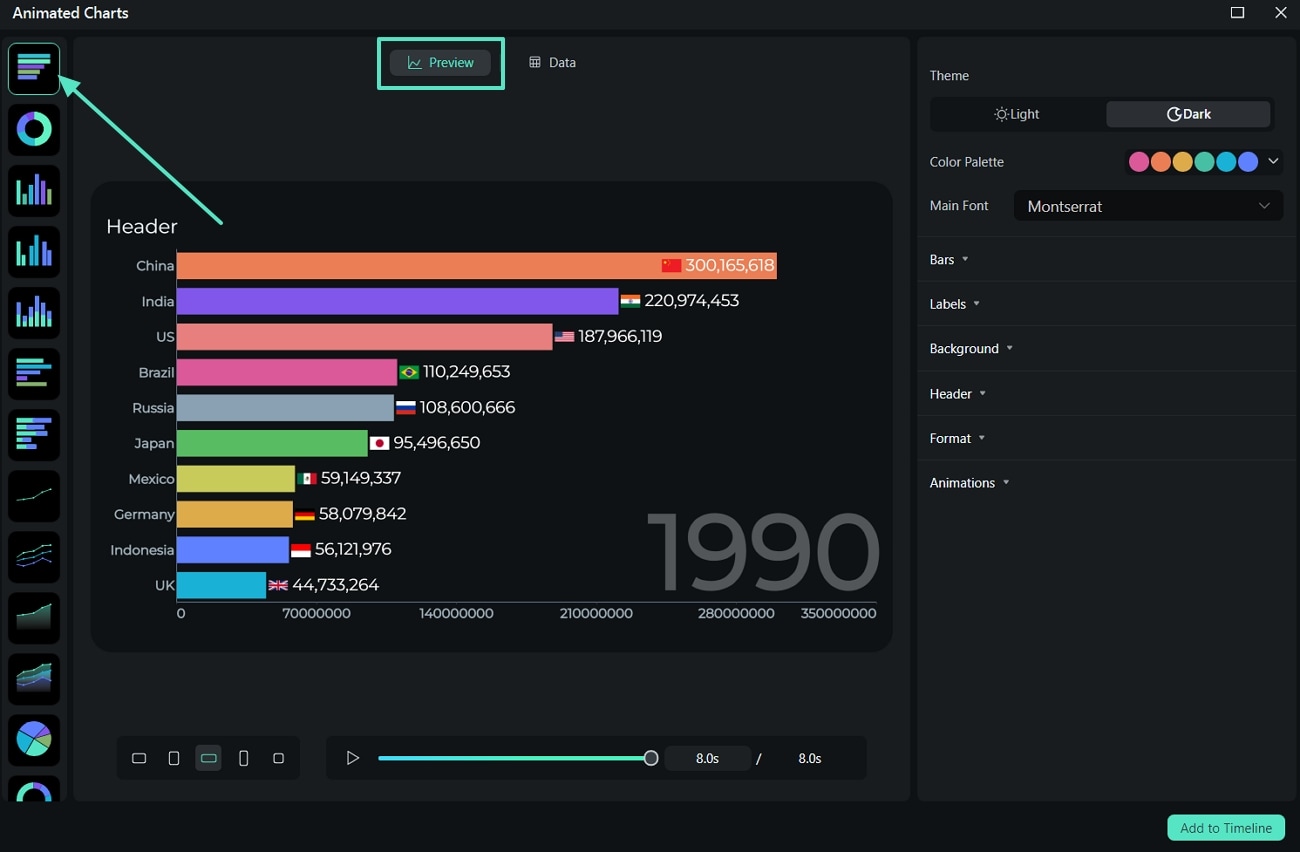
Step 3. Choose a Chart Type
Once you enter the Animated Charts pop-up window, select a Chart Type (such as bar, line, bar chart race, pie, donut chart, and more) from the left sidebar in the Preview section.
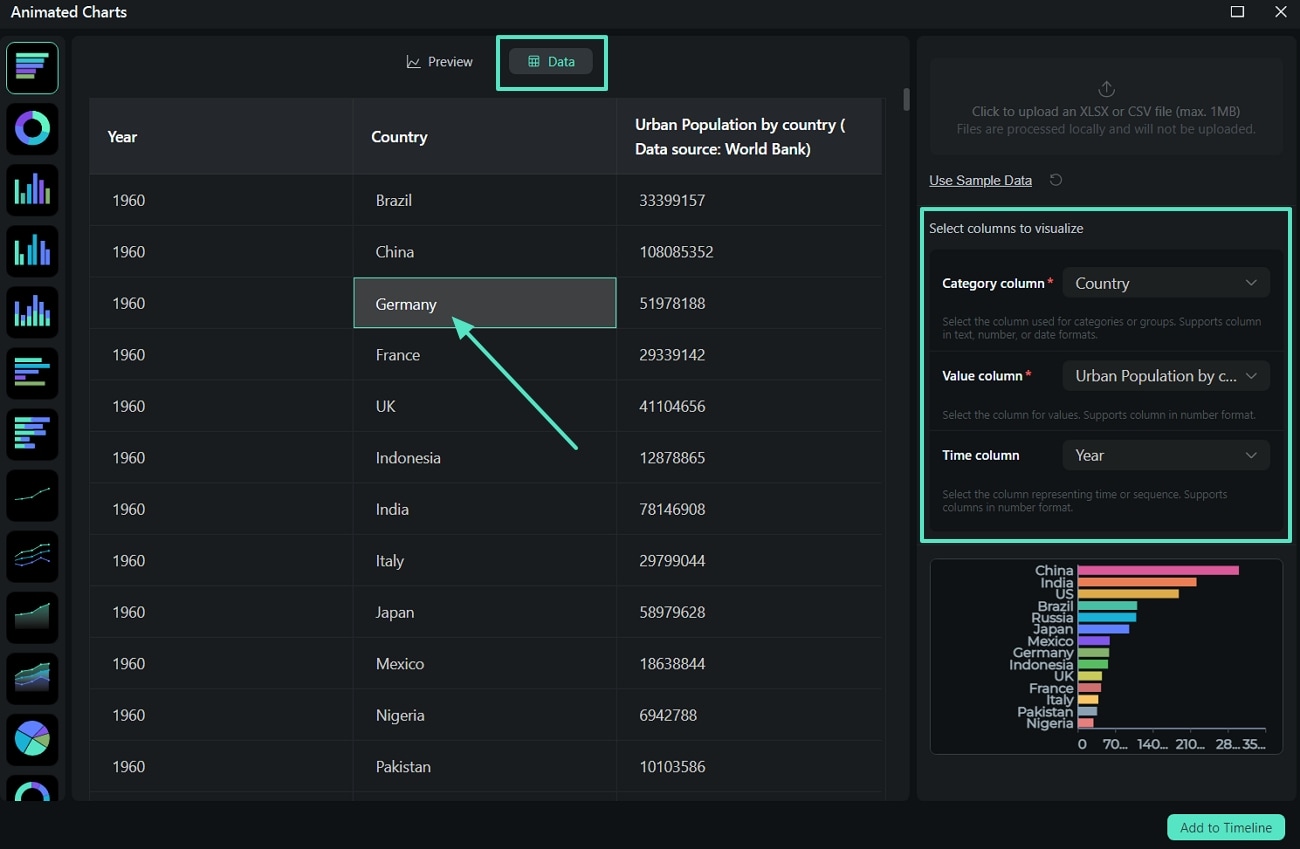
Step 4. Import the Data File and Adjust
Then, jump to the Data section and import the data file you want to use. Manage the data properties like the Category Column, Value Column, or the Time Column. You can also double-click on the data list to alter the names or values as per your needs.
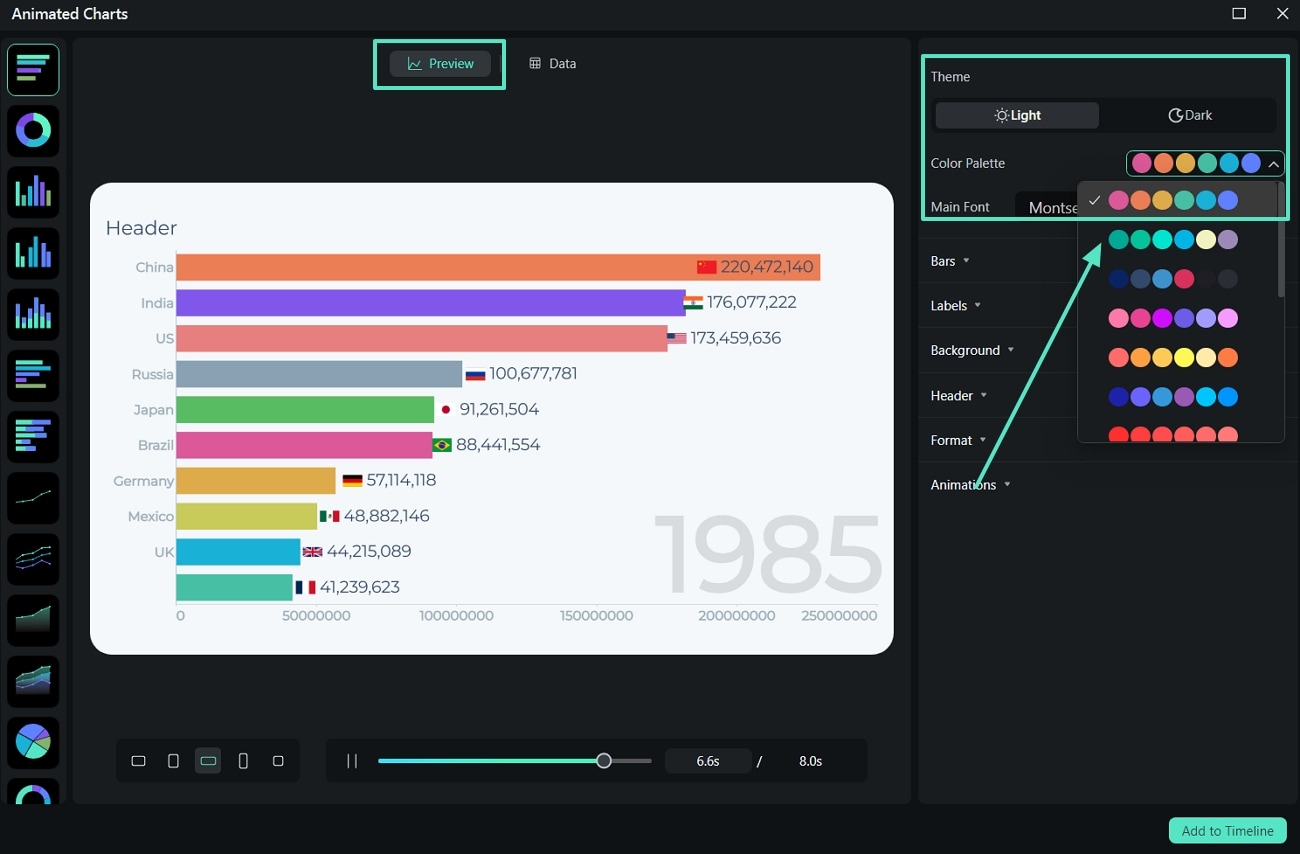
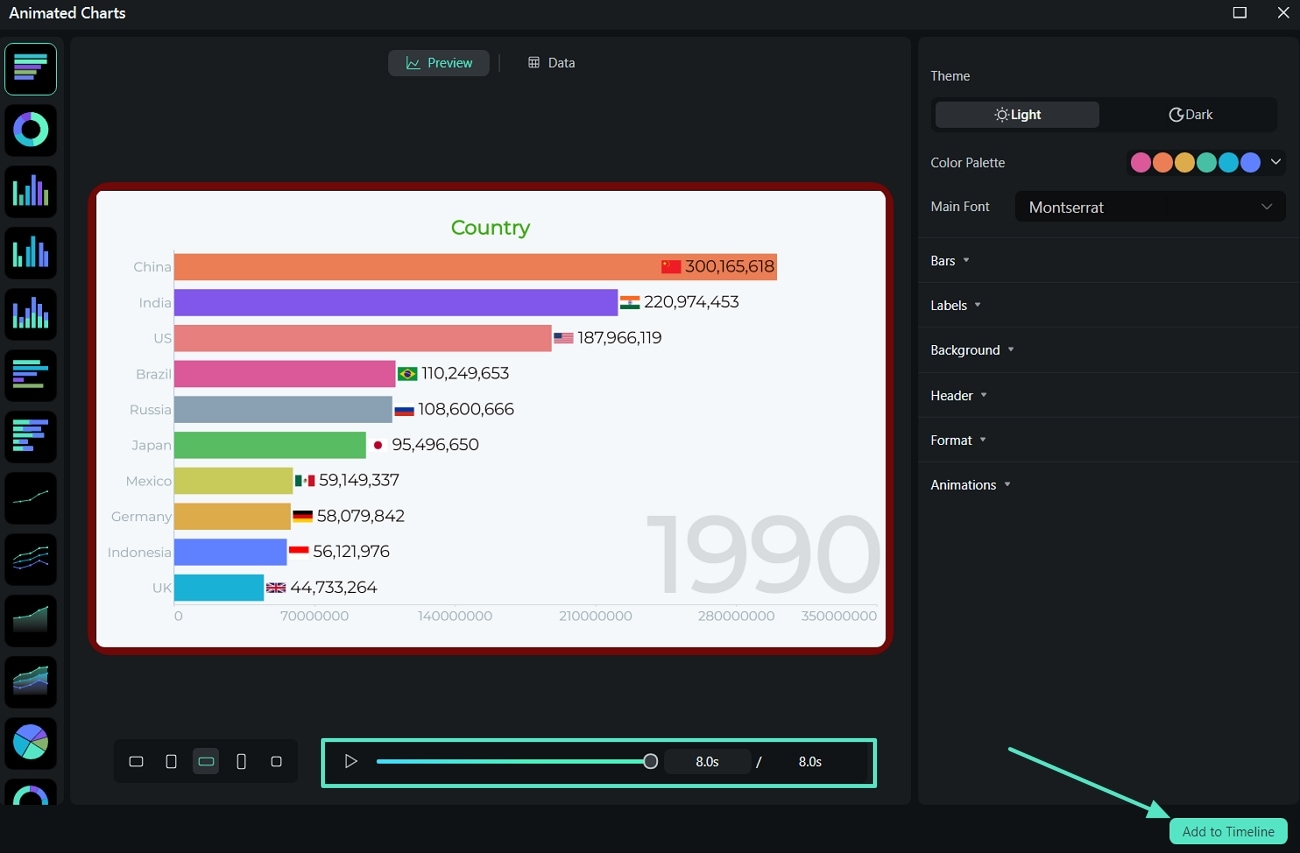
Step 5. Alter the Animated Chart Preview Properties
Next, shift to the Preview section, adjust the Aspect Ratio of the graph you want to be in from the bottom of the window. At the right side you can adjust the Theme, Color Palette, and Font of the animated chart.
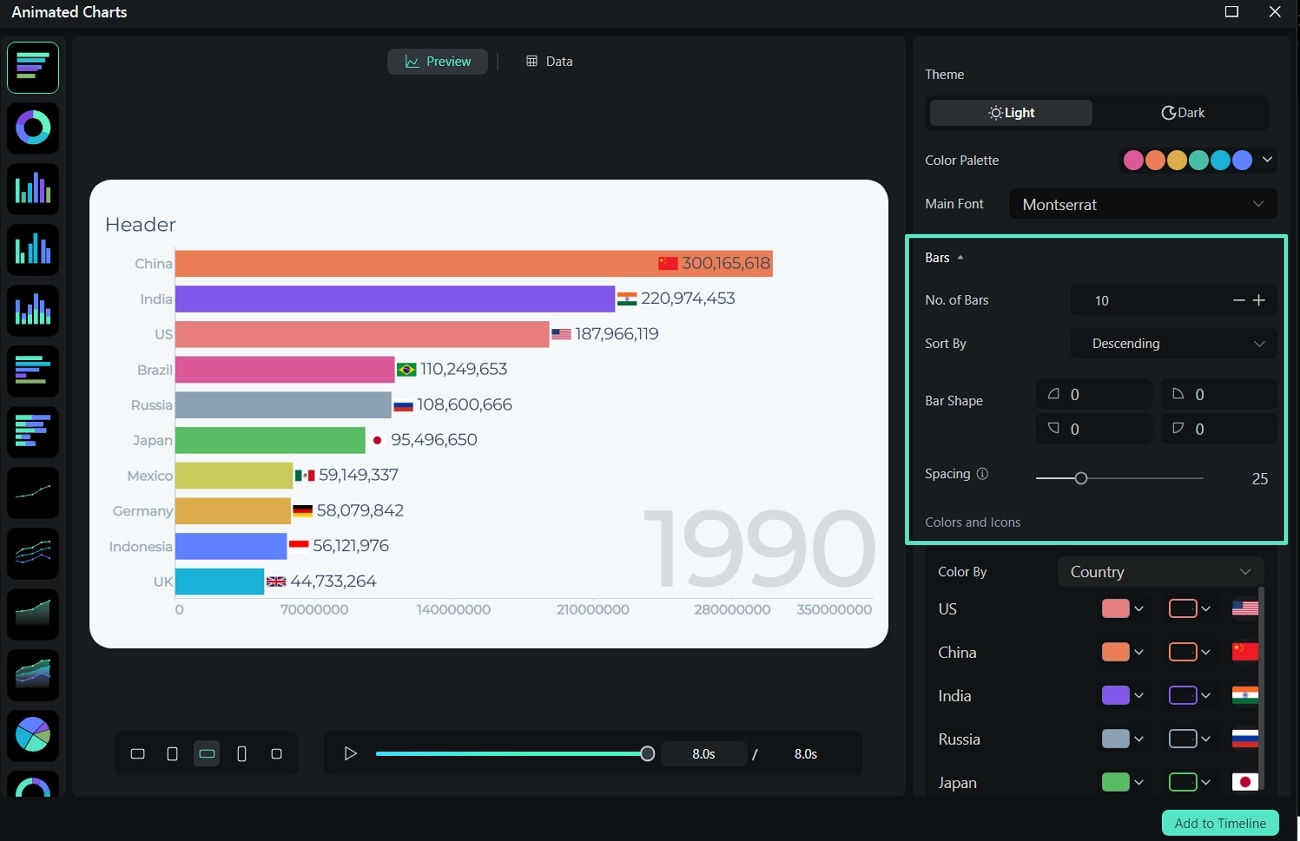
Step 6. Adjust Bars Style
Scroll down to start adjusting the chart's Bars style, like Bar Shape and Color, or the No. of Bars and Spacing between bars.
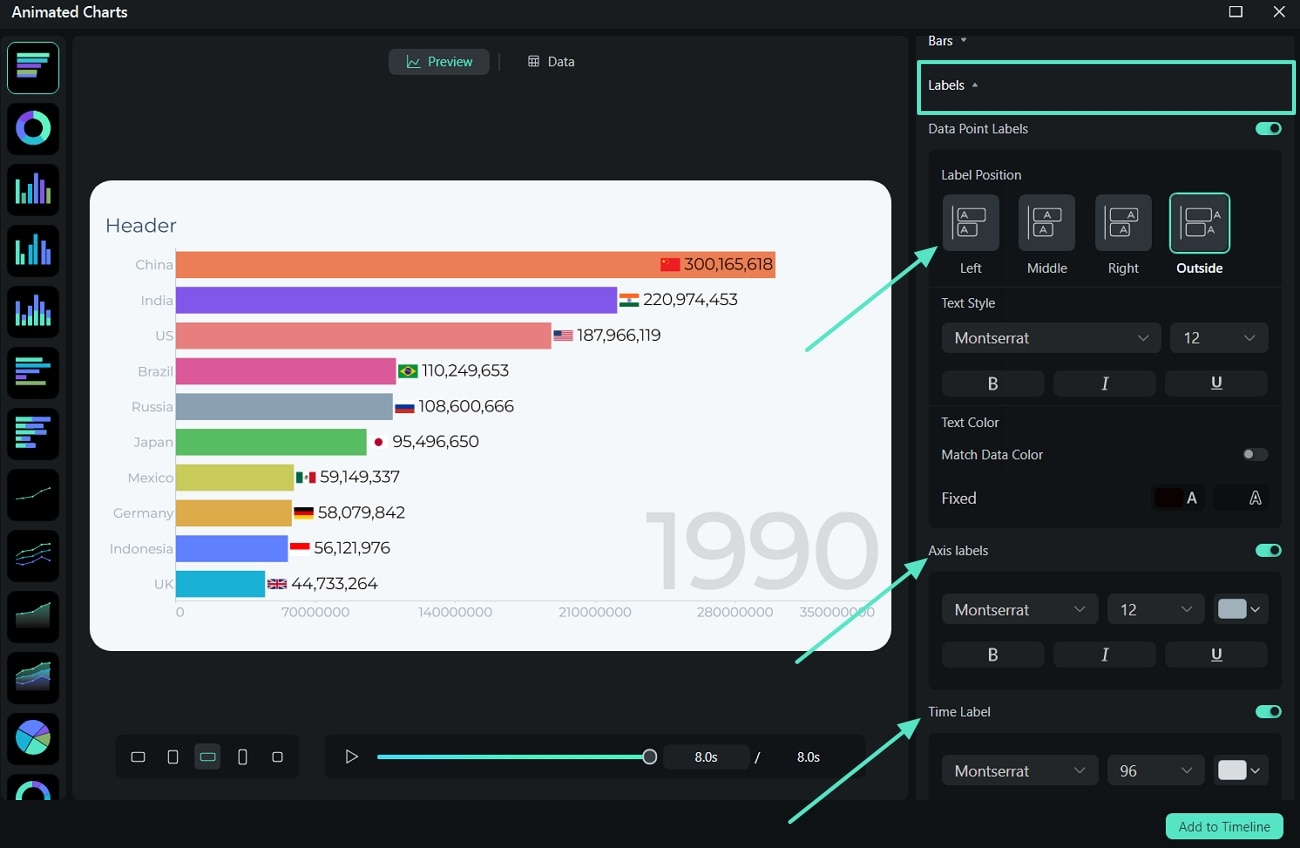
Step 7. Highlight the Labels Required
Move on to the Labels section and pick the best Position for the graph label. Below, you have the option to adjust the properties of the Axis Labels and Time Label as well.
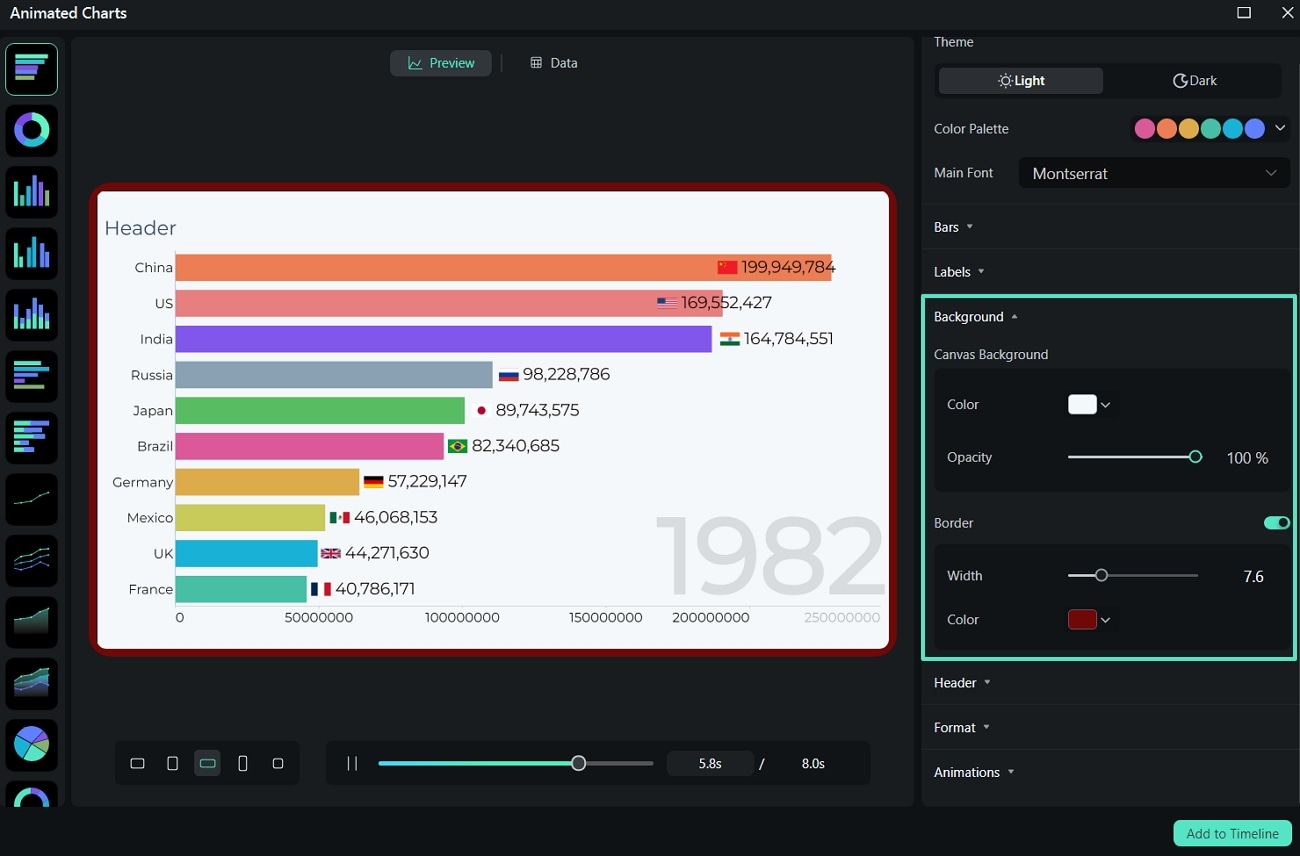
Step 8. Change the Background and Border to Match the Video
Moving on, scroll to the Background section and extend the menu to adjust the background colors depending on the video. Enable the Border toggle to adjust the Width and Color as per your requirements.
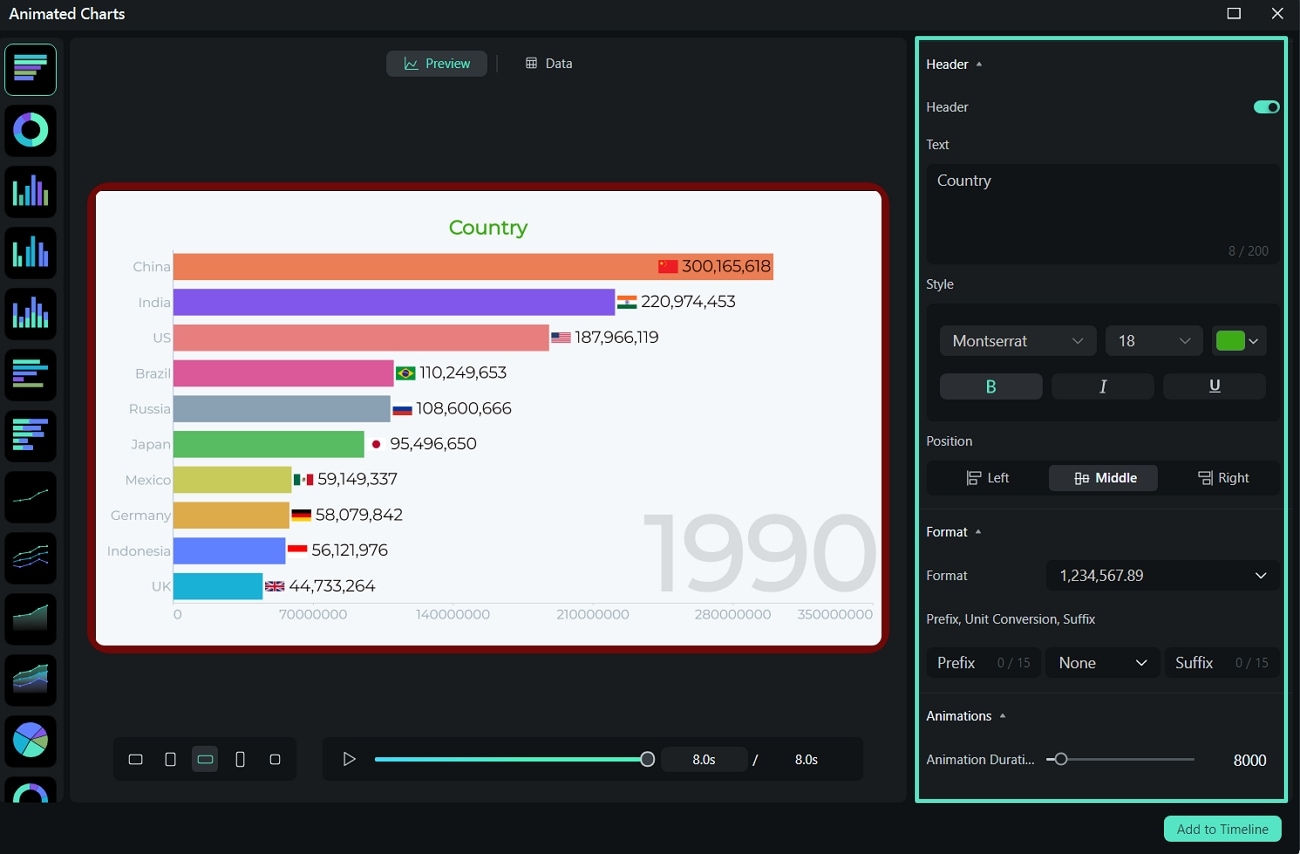
Step 9. Edit the Header and Adjust Animation Duration
Extend the Header section and enable its toggle. Then edit the Text, change the Style, and adjust the Position of the header as per your requirements. Then, using the Format section, you can adjust the Prefix and Suffix accordingly. Extend the Animations section to adjust the Animation Duration.
Step 10. Add the Animated Charts to the Timeline
Finally, use the Play button to preview the final result of the animated graph and hit the Add to Timeline button to add the animated charts to the timeline for further video editing.
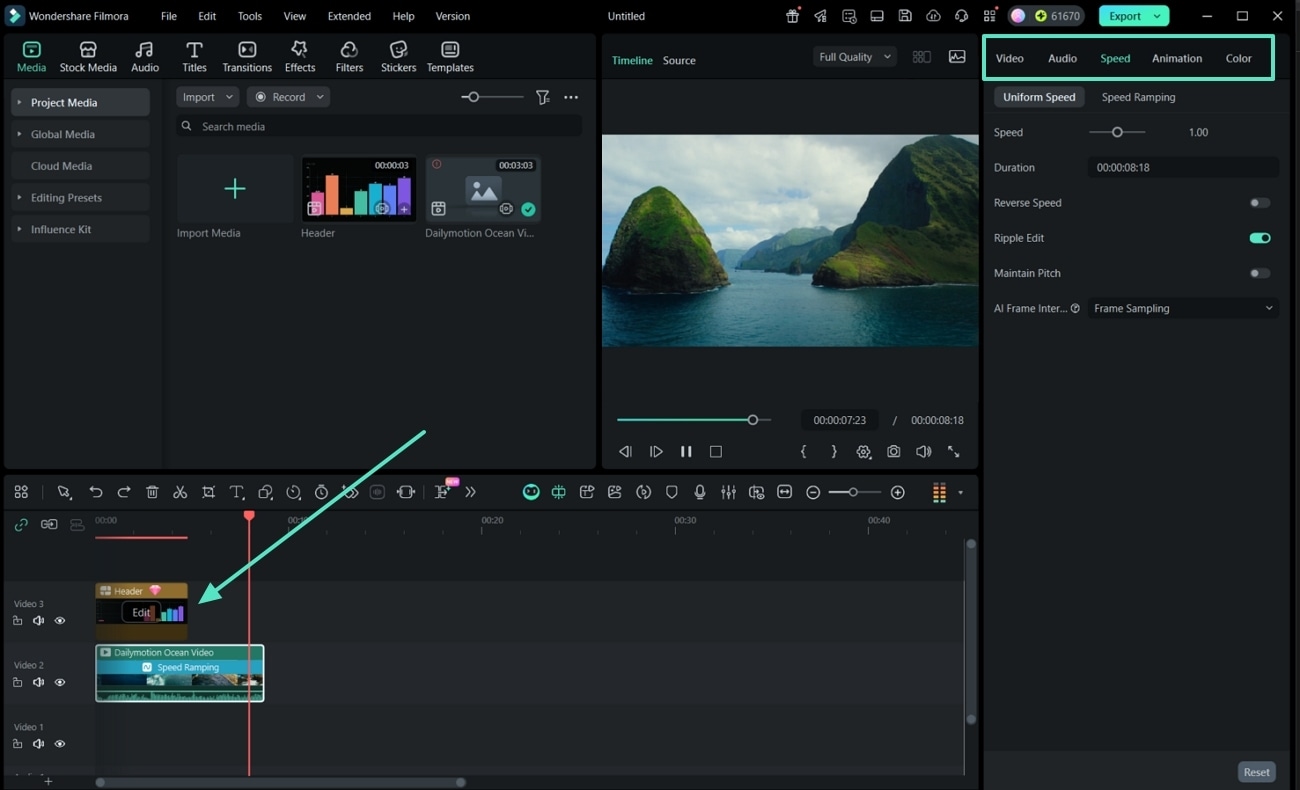
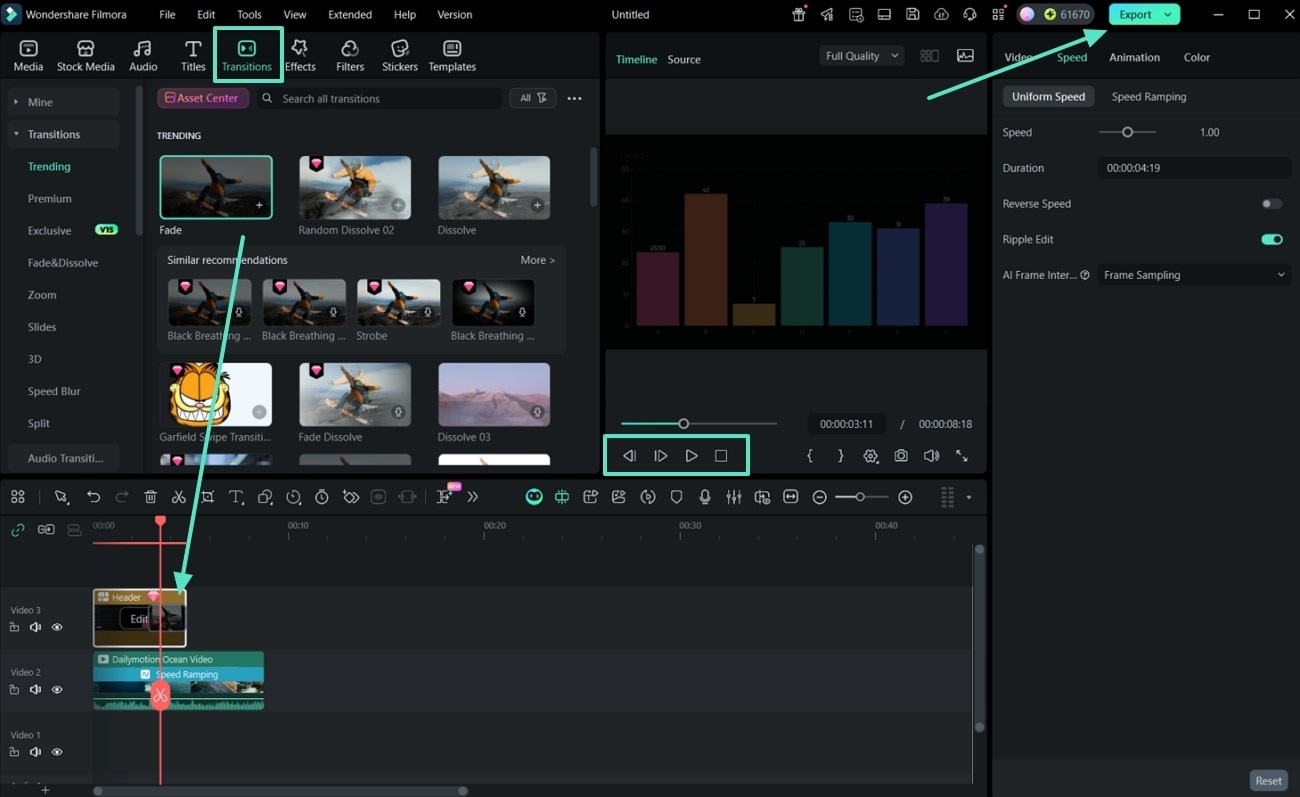
Step 11. Edit the Visual Parameters of the Graph
Upon adding the graph to the timeline along with the video, adjust the Video, Audio, Speed, Animation, and Color to the content to maintain a match between the two. After the chart is added to the timeline, you can click Edit to open the Animated Charts editing window again if you want.
Related Posts
Featured Articles
2026 Updated | How to Crop Videos in iMovie?
Do you want to know how to crop a video on iMovie on Mac? Here is a step-by-step guide. You can also learn whether iMovie can crop a video on an iPhone or not.
How to Make Cinematic Videos Using Color Grading in iMovie?
Are you looking for professional iMovie color correction skills? Check how to make cinematic videos using the iMovie color grading feature here.
Best Free Discord Logo Maker | Updated 2026
This article will look at the best free Discord server logo makers as well as some download sites for Discord logos. Read on to discover more.
Recommended User Guide
Body Effects for Windows
Learn to add Body effects to your videos using Filmora.
Boris FX effects | Filmora Windows Guide
Learn how to add and modify Boris FX Effects in Filmora.
Retouch Guide for Windows
Want to enhance the features and complexion of your videos with facial shots? Find out how Filmora's Retouch feature addresses such issues.